Quarterly Letters & Insights
CAZ Investments Quarterly Letter 2023 – Quarter 2
The Ultimate Dichotomy
Risk assets are rising, and risks are increasing… huh? Something is very wrong with that statement. Yes, thus the reason for the header. There is a major dichotomy between what the stock market is signaling and what the bond market is telling us, along with data, data, and more data. Ultimately, which will be right will be something for the record books, but we felt it was very important to share with you how we are interpreting the noise.
We have a major Principle as a firm to “Find What Matters and See the Forest, Not the Trees.” We have talked about it in this forum before. It is easy to say and hard to do, like many things in life, but in the financial markets sometimes it is actually quite simple, IF one can remove emotion from the equation. Today the data is very clear. We will not restate some of the key metrics we have talked about in the past, such as the inverted yield curve, the plummeting money supply, among others, but we do feel it is very helpful to look at some straightforward data that helps us identify where there is risk and opportunity.
The first thing to mention is that the rally experienced by stock markets in the second quarter was significant IF you owned the right stocks. The rally was very narrow and has created a new, slightly frightening, moniker for the companies leading the way. Gone is FANG and FAANG, and the world is now swooning over the “Magnificent Seven.” Those seven mega-cap companies now make up more than 50% of the entire Nasdaq 100 Index and, depending on the day, represent nearly 30% of the entire capitalization of the S&P 500 Index… yes, the other 493 companies make up the rest. To say that they have an outsized impact on the returns of the index is an understatement, and that group was down 49% from their collective peak in November of 2021 to the lows in the fall of 2022. So, what goes up absolutely can come down and that creates a unique challenge for investors making decisions today.
We also know that some of the correlations that have held up for the entirety of this cycle have begun to disconnect. As an example, the amount of Reserve Balances held by commercial banks has been a near perfect match to stock performance, until March, when stocks rallied despite flat/down Reserve levels. Likewise, the 10-year Treasury Inflation Protected Securities (“TIPS”) have been a great indicator of valuations for the Nasdaq 100, and they have moved in lockstep, until the latest tech stock surge. For good reasons or bad is unknown, but we can definitely say that either stock prices are going to revert to the mean or “it will be different this time…”
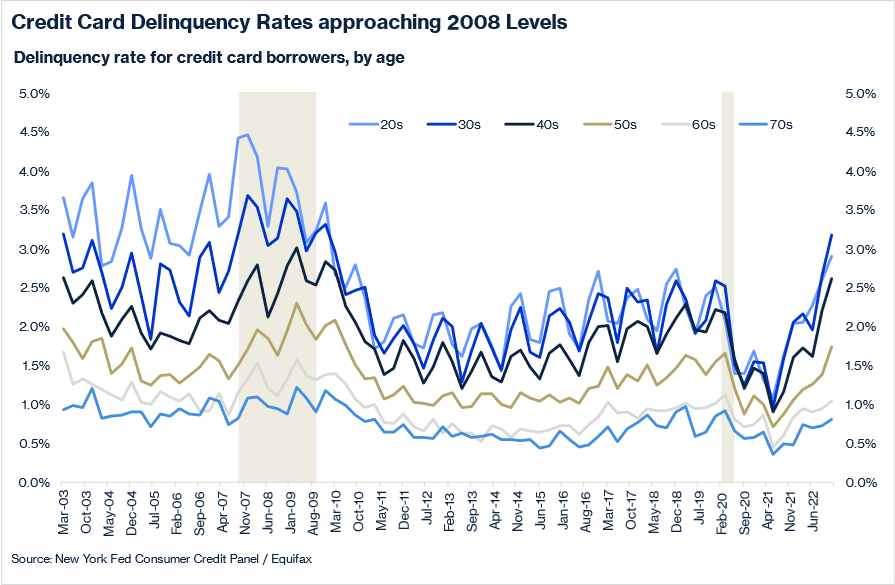
From there, the data we are seeing in the regular ol’ economy is not encouraging. In rapid-fire fashion, let’s look at some consumer data. First, we showed last quarter how credit card interest rates were now more than 22% on average, and how that was likely to impact the average consumer in a significant way, as they have spent the savings they accumulated from the government giveaways during Covid. Sure enough, the data is now supporting that hypothesis and delinquency rates are now approaching the highest levels we have seen since the depths of the Global Financial Crisis (“GFC”). Yet, officially, most economists say we are not even in a recession yet. Those families would likely disagree.
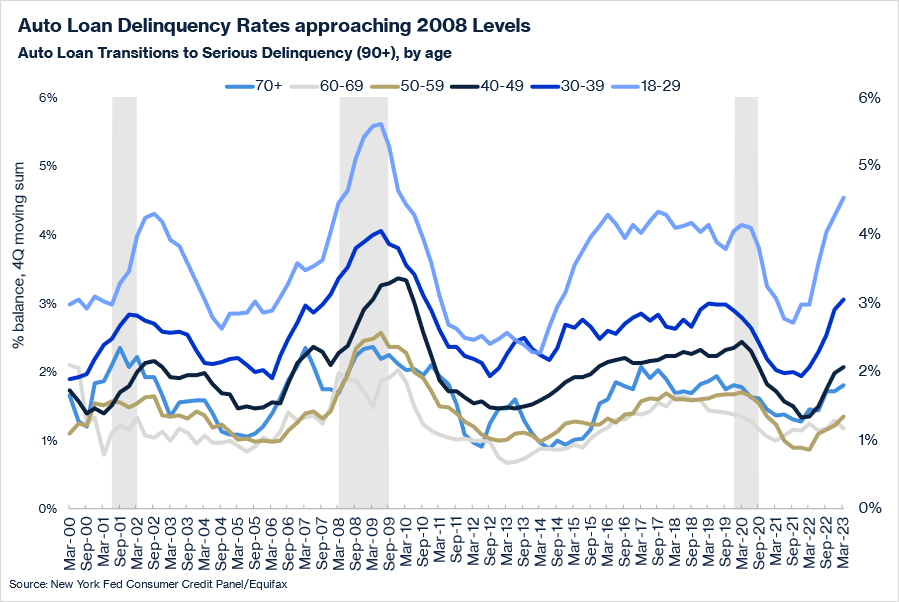
Last quarter we also showed a simple chart related to Auto Loans and how many consumers are now getting very stretched. The data continues to worsen and, again, we are now approaching the worst levels we have seen since the GFC.
One critical piece to note is how all of this data was becoming a real problem BEFORE the Supreme Court ruled that yes, indeed, people that borrowed money for schooling will actually have to pay those student loans back. That means that the average borrower, many of whom are already delinquent on other debt, will now start having to make a payment of approximately $250 every month, on average, starting September 1st. That does not bode well for spending habits, or default rates in the consumer space.
Speaking of default rates, the consumer is not the only place for concern, so we will update you on the rate of corporate bankruptcy filings. Below you can see that bankruptcies in the first half of 2023 were the most significant we have seen since the middle of Covid, and 2010 before that. This trend is likely to accelerate as the impact of higher borrowing costs permeate the financial statements of borrowers across the country, in most every market segment and industry.

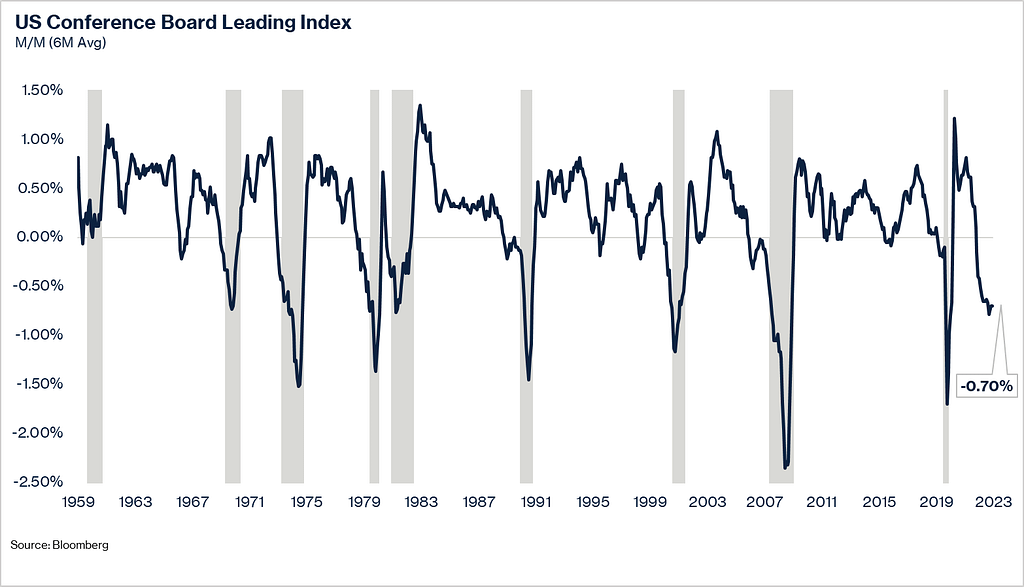
The other major sign that investors appear to be ignoring is the Conference Board Index of Leading Indicators. This is a compilation that includes ten different components, such as new orders, credit conditions, consumer expectations, etc. As shown below, the Leading Indicators are declining at a significant rate, similar to what transpired in every recessionary period (shown in gray). Naturally, things can be “different this time,” but we would be very surprised if such historically reliable signs, like the Leading Indicators and the yield curve, would be significantly wrong this cycle.
To be fair, there are some positive things to mention related to the economy, such as the resiliency of the job market and the game-changing, productivity driver, that is artificial intelligence. The problem with the strength of the job market is that it is likely to keep the Federal Reserve in a box, where they have no choice but to keep interest rates higher for longer than people are hoping. And of course, that radical shift from AI is going to take some time and will clearly lead to massive job cuts, but that is a topic for a future letter…
So, if one looks hard enough, there are some positives to find in the data and we may indeed manufacture a “soft landing” in the economy. Only time and the ripple effects of higher interest rates will tell, but we will invest on the basis of what we see as the Forest, Not the Trees, which lead us to focus on good ol’ fashioned metrics, such as cash flow and valuations.
Yes, Valuations Still Matter!
Next, we will use a similar tool to one we have used in the past to illustrate how valuations do matter. We have historically shown how various metrics, such as price to sales and price to earnings, and what people pay for an asset will impact the returns in the future. After the dramatic increase in interest rates, it is critical to evaluate valuations compared to those higher rates, which we know should always be a major factor in every investor’s decision. People kind of forgot how important rates are to analysis, for the last several years as interest rates hovered around zero, but they are now much higher. That means investors must dust off their finance textbooks and remember the basic blocking and tackling tools for investment analysis.
Every asset, with virtually no exceptions, should be compared to what an investor can earn in a different asset. Investors have choices, and they will go where they feel they have the best risk/reward. Thus, the “risk-free rate” most commonly referenced as United States T-Bills, is where people start their evaluation. From there they go into the future, along the Treasury curve, to evaluate longer dated assets, such as stocks, real estate etc. What normally should happen is that the expected duration of the investment will dictate how far in the future along the Treasury curve an investor will look to compare one alternative vs. another.
It is straightforward in some asset classes, as you are comparing one yield vs. another yield. A good example of this would be High Yield Bonds vs. U.S Treasuries. You simply know that if you are earning 7% in a High Yield Bond vs. 4% in a U.S. Treasury, with the same maturity, that you are getting a 3% “spread over Treasuries.” That allows you to decide if you think 3% is enough of a “Risk Premium” to take the risk in that High Yield Bond… Either investors believe it is a good Risk Premium and the price will rally, bringing the yield down, or it will be considered too risky and the price will fall, taking the yield up. That is investing 101 and investors ignore this massively important concept at their own peril. Remember the overvaluations at the end of 2021…?
In other assets like stocks, investors use a different term, which is “earnings yield.” This is because it reflects the amount of cash flow/earnings that you would expect to earn on the asset. Further, in some sectors like real estate it is referred to as a “cap rate.” In all cases, investors are trying to get to a common comparison, and it is based on how much money they expect to make from the dollars they invest. As an example, if I invest $100 and expect to get an average of $5 of profits/cash flow per year, then it is a 5% yield, a 5% earnings yield, or a 5% cap rate… Why are they called different things? That is anyone’s guess but to further complicate things, for some reason, stock market investors use the inverse and call it a Price/Earnings ratio. In the example above, if one buys a stock at $100 that is making $5 in profits, the markets say the stock is trading at 20x earnings. Yes, that is the same as a 5% earnings yield, or a 5% cap rate… Only by comparing the earnings/yield between different assets can investors make good decisions. So, with that level of understanding on what an Earnings Yield is, we can consider what an Equity Risk Premium is.
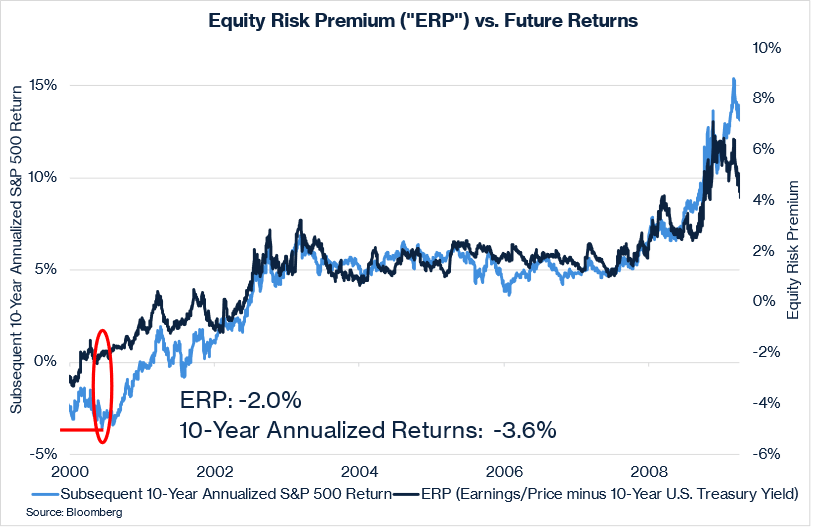
The Equity Risk Premium, hereafter referred to as the ERP, is commonly defined as Earnings divided by Price (the Earnings Yield we explained above), minus the 10-year U.S. Treasury yield. For full disclosure, the full composition of ERP can often include more than just Earnings Yield, but for the ease of discussion, we will utilize this common approach as it more than illustrates the point. The first chart below illustrates that when you compare the ERP to the returns for the S&P 500, the correlation is undeniable. Quite simply, if there is an exceptionally low ERP then investors can expect very low returns over the next 10 years. If there is a high ERP, then investors can expect to make solid returns for the next 10 years. As we have stated for decades, valuations always matter! Included in that statement is the imperative that has been missing from the equation for most of the last decade, valuations relative to interest rates REALLY matter!
To be sure everyone understands the layout of the chart, the scale on the left side of the chart shows the 10 year returns of the S&P 500 and the scale on the right side of the chart tracks the ERP. The correlation is clearly shown by the fact that the lines move very much in lockstep, in that when the ERP is high, stock returns are high for the following 10 years and when the ERP is low, stock returns are low for the following 10 years. For the most analytical readers, the correlation has been more than 93% since 2000. The data is irrefutable, and most importantly, it is logical that when valuations are better, investors do better…
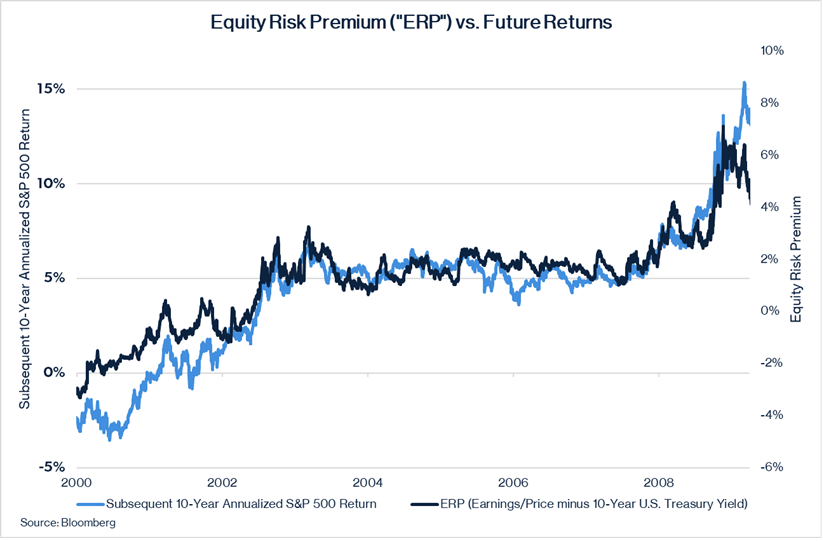
As we explore the chart in more detail, we will start at the bottom left corner, in that overhyped period referred to as the Tech Bubble of 1999-2000. There we see that the ERP was a NEGATIVE 2%, which is hard to imagine, but that is what happens when stock prices get very overheated. Investors were willing to ignore the yield they could get on Treasuries because they were convinced that stocks would simply continue to go up no matter what price you paid for them… Well, they were obviously wrong, as for the next 10 YEARS, the S&P 500 delivered a negative 3% ANNUALIZED return. Yes, that means that after 10 years, investors had less money than they started with! And that is precisely what eviscerated the retirement plans of many investors.
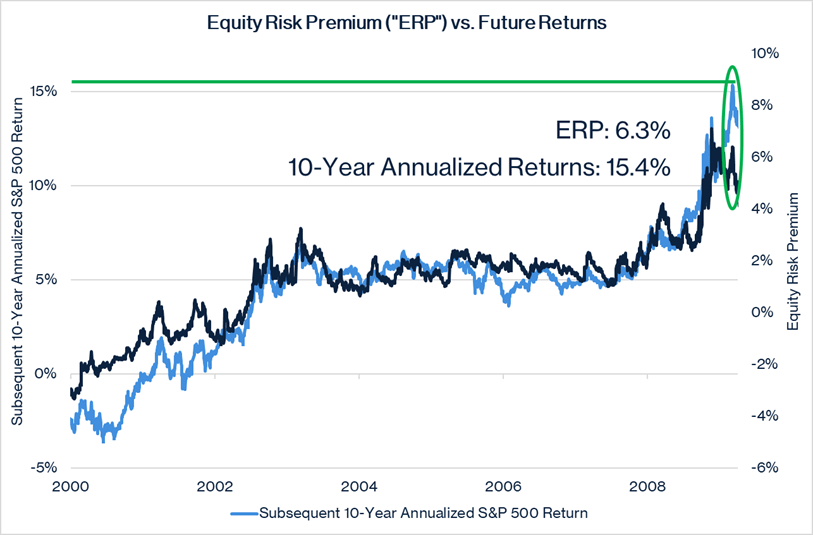
And, of course, the inverse is also true, so let us move to the top right of the chart. There we will find the nadir of the GFC, in March of 2009. (Side note: If you go to the News and Insights tab on our website, you can read the letter we sent to all our investors in March of 2009, titled “The Buying Opportunity of our Generation.”) There you can see that the ERP was over 6%, a more than 8 percentage point swing from where it was in 2000. Investors were being compensated extremely well to take risk, and those that had the courage and conviction to do so were rewarded with more than 15% ANNUALIZED returns for the next 10 YEARS!
Now we need to fast forward to today. What has happened in the last year and a half? We had a brutal bear market in most every asset class and the Federal Reserve raised rates faster than any time in history. Interest rates along the Treasury curve have gone up due to inflationary concerns and we are now sitting with a 10-year U.S. Treasury yield that is higher than we have seen since 2008. Thus, investors would be foolish not to consider what they can earn on a “risk-free” asset when evaluating where to invest their capital. Yet, despite the bludgeoning that investors endured in 2022, they have returned to their speculative ways and bid stock prices up quite dramatically since the lows experienced in October. What is worse is that the vast majority of the increase in stock prices has strictly come from valuation expansion, and from relatively few companies, as discussed at the start of this letter. It certainly has not come from earnings growth, as earnings for the Index continues to decline. To be fair, the market is a forward-looking animal and is clearly anticipating better company profits in the future, but there is an economic minefield to cross on the way to a “soft-landing” and renewed growth, without inflation… And as we showed above, there are definitely a plethora of land mines to deal with on that path to safe territory.
The result of this market rally, married with rising interest rates, is a rapidly declining ERP. So, we go back to the chart again below that is now updated through present day. You can see on the far right of the chart that the ERP spiked dramatically in March of 2020, during the middle of Covid, when stock prices plummeted, as did interest rates. That created a very brief period where investors could invest in stocks at a more than 6% ERP. Ever since then, even though stocks declined in 2022, the ERP has basically continued to get worse. How is that possible? Simple, interest rates have gone up faster! And now that stocks have rallied in the last six months, without an increase in earnings, we have an ERP that is below 1%! We have not seen that level since early 2008. If that does not cause you to shudder a bit, we need to have a conversation about risk…
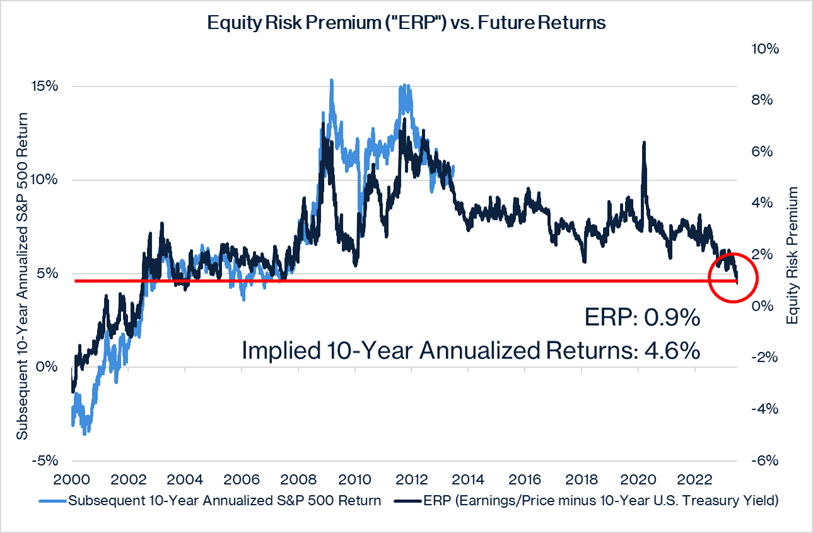
If the correlation persists for this relationship between the ERP and forward stock market returns, which would be logical, then the next 10 years would be expected to generate less than a 5% annualized return. Thus, if someone can buy a 10-year U.S. Treasury with a yield above 4%, why would they want to take significant risk owning stocks?
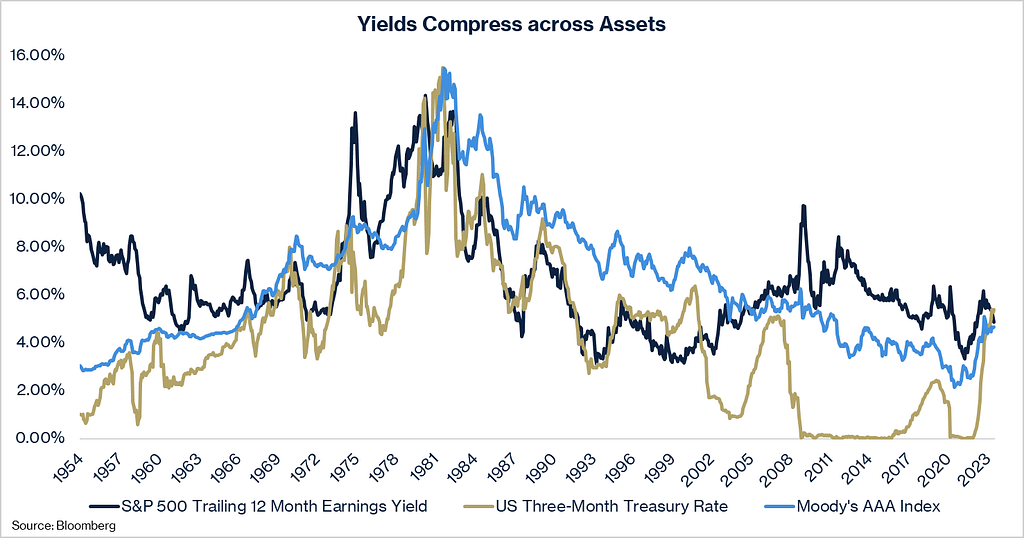
Now that we are all on the same page regarding ERP, one last chart will really help illustrate the importance of this point. This chart shows the S&P 500 Earnings Yield, along with U.S. Corporate Investment Grade bonds and the U.S. 3-month Treasury rate. As one can clearly see on the right side of the chart, all three yields have converged to the point that investors no longer have an incentive to own U.S. equities. At no time in the last decade, rarely in history for that matter, have stock market investors been paid less for the risk they are taking owning stocks relative to bonds/cash.
For full clarity, this does not mean that all stocks are bad, or that investors should sell everything they own, but what it does mean is that investors should be honoring risk and seriously evaluating their asset allocation to be sure they can live with the downside. Naturally, some investors are hoping (we have talked many times about how “hope is not a good investment strategy”) that interest rates are about to reverse and start dropping again. That is certainly possible, but the data is irrefutable, which shows that that investors are not being paid well to take risk in the S&P 500. There are still pockets of opportunity in the equity markets, but in order to feel confident that we have the potential for good risk-adjusted returns, we must be careful to not invest in just plain vanilla stocks.
It is for all these reasons that we remain a “1” on the CAZ Scale, and we strongly believe that the risk/reward in plain vanilla stocks is not favorable. This is why we consider the current opportunities in the private markets to be significantly better than what is offered in the public markets.
The Dislocations are Just Getting Started
On top of this fascinating decline in the ERP, we are just now beginning to see distress in certain markets. One would expect that the stress being experienced in commercial real estate, regional banks, venture capital, distressed credit etc., would cause the ERP to rise, as opposed to fall, but that is simply not happening. That said, the Risk Premium in those specific areas mentioned has expanded quite nicely and that is where we are very excited about deploying capital. In some areas, the prices have come down dramatically and are offering very compelling values. Indeed, we expect in many of those areas that prices have only begun to fall and the next two to three years could provide some of the best buying opportunities we have seen since the GFC.
As we showed above, we see tremendous stress on the consumer, many average businesses, and, of course, commercial real estate. We have begun to deploy capital in these segments, as the risk/reward is becoming compelling. If you are not familiar with what we are doing in these areas, please allow us to share with you where we are investing our personal money and how you can partner with us in those opportunities.
U.S. Debt Downgrade
As we were finishing this letter, there was breaking news that we felt needed to be addressed. In early August, the ratings agency Fitch downgraded the U.S. government credit rating. This nearly unprecedented action sent minor ripple effects through the markets but has not yet created tremendous anxiety. The “yet” is not a prognostication that it will happen, rather just a statement that it has not yet happened, although it certainly could. The U.S. government is still the safest place to invest capital because it has proven its willingness to print an unlimited amount of money, regardless of the impact on inflation. If that appetite waivers, or becomes unsustainable, then there could be much broader ripple effects on the capital markets.
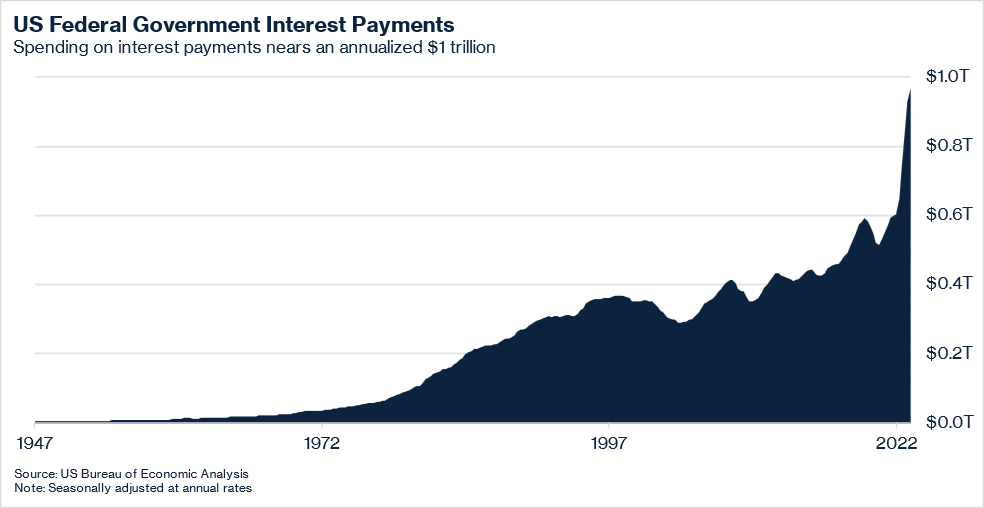
One thing is for certain, the downgrade has gotten people talking about the lack of fiscal responsibility exhibited by our government on both sides of the aisle, and how something is going to have to change. To provide a few data points, the first chart below shows how the recent rapid increase in interest rates is causing the debt service burden on the government to skyrocket. Prior to Covid, the U.S. government was spending roughly $500 billion a year in interest payments. Not principal payments, just interest… Imagine how much money that is for a minute, but don’t imagine it for too long, because, as a result of the massive increase in borrowings by the government to fund dramatic budget deficits and new programs coupled with a very significant increase in the interest rate on those borrowings, the U.S. government is now spending close to $1 TRILLION a YEAR on interest expense alone! And yes, we still must eventually pay down the principal as well.
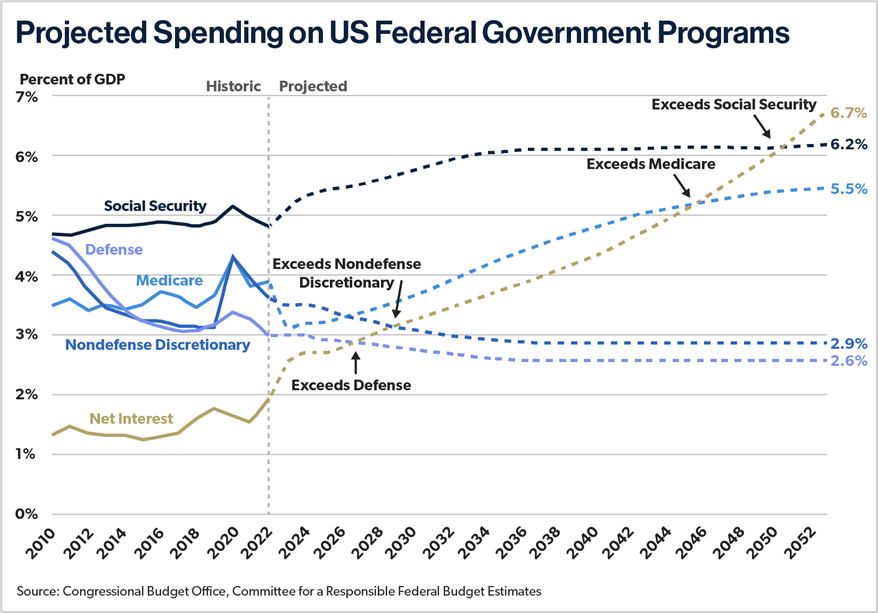
What is more frightening is the relative cost of the interest expense when compared to our other obligations and programs. As the chart below shows, we are now projected to spend more on interest expense than we do on national defense, all non-defense discretionary spending, Medicare and even Social Security. Based on the math, it appears that we will be spending nearly three TIMES as much on interest expense as we do on all non-defense discretionary spending. That is hard to fathom. Politicians will be happy to explain how this will not ever be a problem, but we have not seen any politician explain why it will not be a problem, we are just supposed to take their word for it… Clearly, Fitch is looking at the math and not just operating on the “hope” being espoused by politicians.
Naturally, we are skeptical and believe this is something that must be addressed in the short run. There are some viable solutions, but they require swift, bold action to have the runway to make a meaningful impact and all options will take enormous political will. Until such action is taken, this is an area that we will continue to monitor as it is one thing that could create an existential threat to financial markets.
Exciting Projects on the Horizon
On a more upbeat note, we are immensely proud of what we have accomplished in the last few years for our investors and our Team. We continue to significantly grow our Team, both in Houston and around the country. More investment advisors recognize the value we can deliver for their clients and more families are joining our global network of investors. The flywheel continues to turn as the size of our network enables us to get nearly unprecedented access to some of the most interesting opportunities in the investment world.
As part of the firm’s growth, we are working on several major initiatives that we expect to announce in the latter half of the year and early in 2024. Yes, it is almost time to turn the calendars again and so that means that everyone should already have January 18th, 2024, on their calendars. That is when we will hold our annual Themes event, which we expect to be our biggest ever. Please plan to attend and, if you are from out of town, the hotel room blocks are already open. Please speak to our Team if you have any questions and we look forward to a full day of incredibly interesting content, with the potential for some very unique experiences on the 17th and 19th. Stay tuned for more information and please be sure you register for the event as soon as you receive the official invitation.
Thank you for your partnership and we look forward to hopefully seeing you sometime this fall. All our very best!
The CAZ Investments Team