Quarterly Letters & Insights
CAZ Investments Quarterly Letter 2025 – Quarter 2
Tariffs? What Tariffs?
In the 1st quarter letter, we addressed the enormous volatility in April and May, so we will not expand significantly on our robust comments in that dispatch. That said, we would be remiss if we did not address the continued uncertainty during the balance of the 2nd quarter and what we know as of the date of this writing.
We have said in numerous news outlets that we believe that the President is playing a high stake “game of economic chicken” with leaders around the world. Our belief has been that he is using tariffs as a powerful negotiating tool, with extremely high levels THREATENED but we did not expect exceedingly high ACTUAL tariffs to be in place for more than a short period of time. So far, that prediction is holding true, albeit trying to predict what the President is going to do is tenuous at best… but that is precisely his strategy.
What is definitive is that the approach appears to be working and there are some tariffs that have remained in effect for more than a few weeks, but the vast majority of the threatened tariffs have not been enacted due to negotiated agreements with more than 35 countries, which are significantly better for the United States than existed under the previous arrangement. The benefits should accrue materially over the next few years, with additional tax revenue, more local investment from businesses building capacity to source their materials in the U.S. (“onshoring”), and a more competitive landscape for U.S. companies, most of which should create new jobs.
The uncertainty created by the significant noise of the process is part of what spooked the markets in April. Since then, between the President’s virtually overnight eradication of the hostilities in the Middle East and the victories on the trade front, the “animal spirits” have once again decided to buy risk assets and the markets have been on a tear for the last four months. There has been nary a major pullback to point to on a chart. The good news is that this shows the belief that the President’s approach is working and that the benefits of the negotiations will find their way into the U.S. economy. The bad news is that we find ourselves in rarified air from a valuation perspective…. again.
Just How Expensive Are Stocks?
Over the last nearly 25 years, we have explained valuations in nearly every way possible. Ultimately, what we have learned is that a picture will say a thousand words, and the easier it is for investors to understand what we are trying to communicate, the better. Well, the chart below definitely checks all those boxes. Suffice it to say, “red bad, green good!”
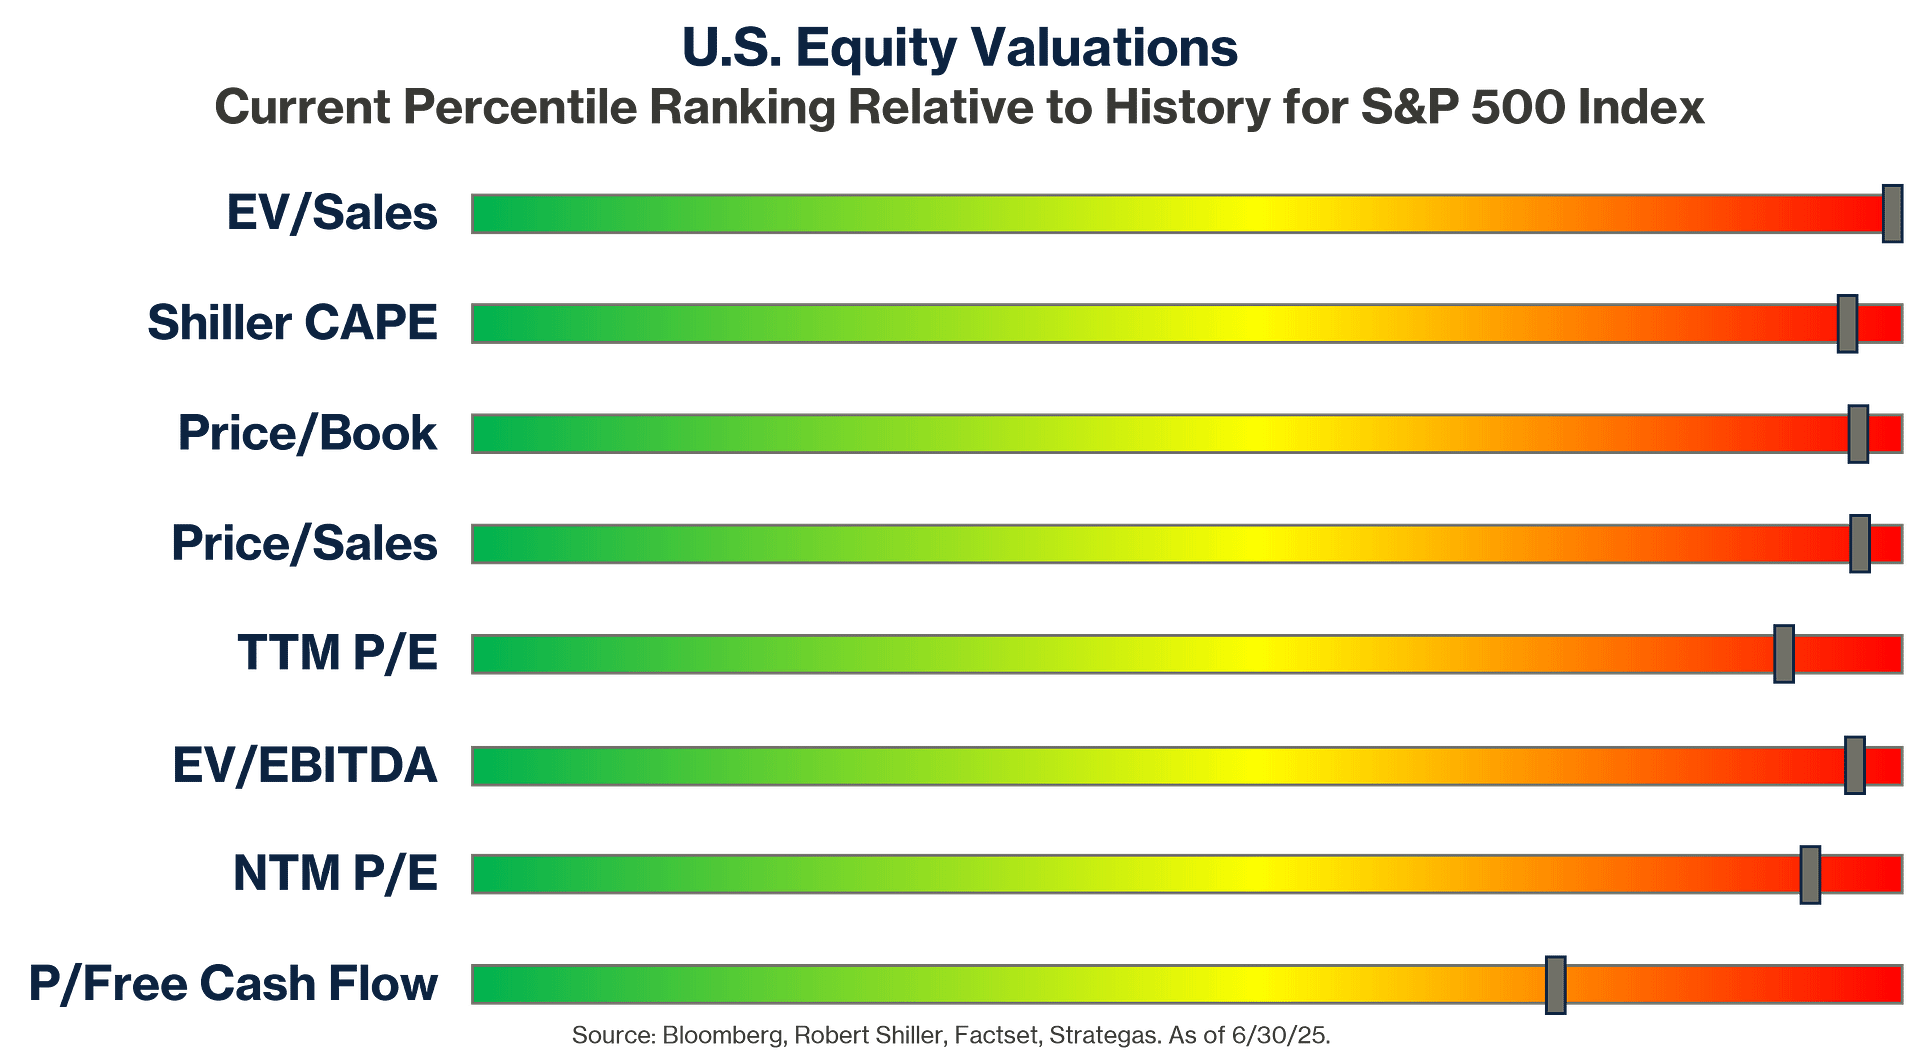
The beauty of this chart is that it avoids any argument as to whether the S&P 500 is cheap or expensive, across virtually every major valuation metric that one could want to use. We find ourselves in extreme levels of red… remember, red bad…
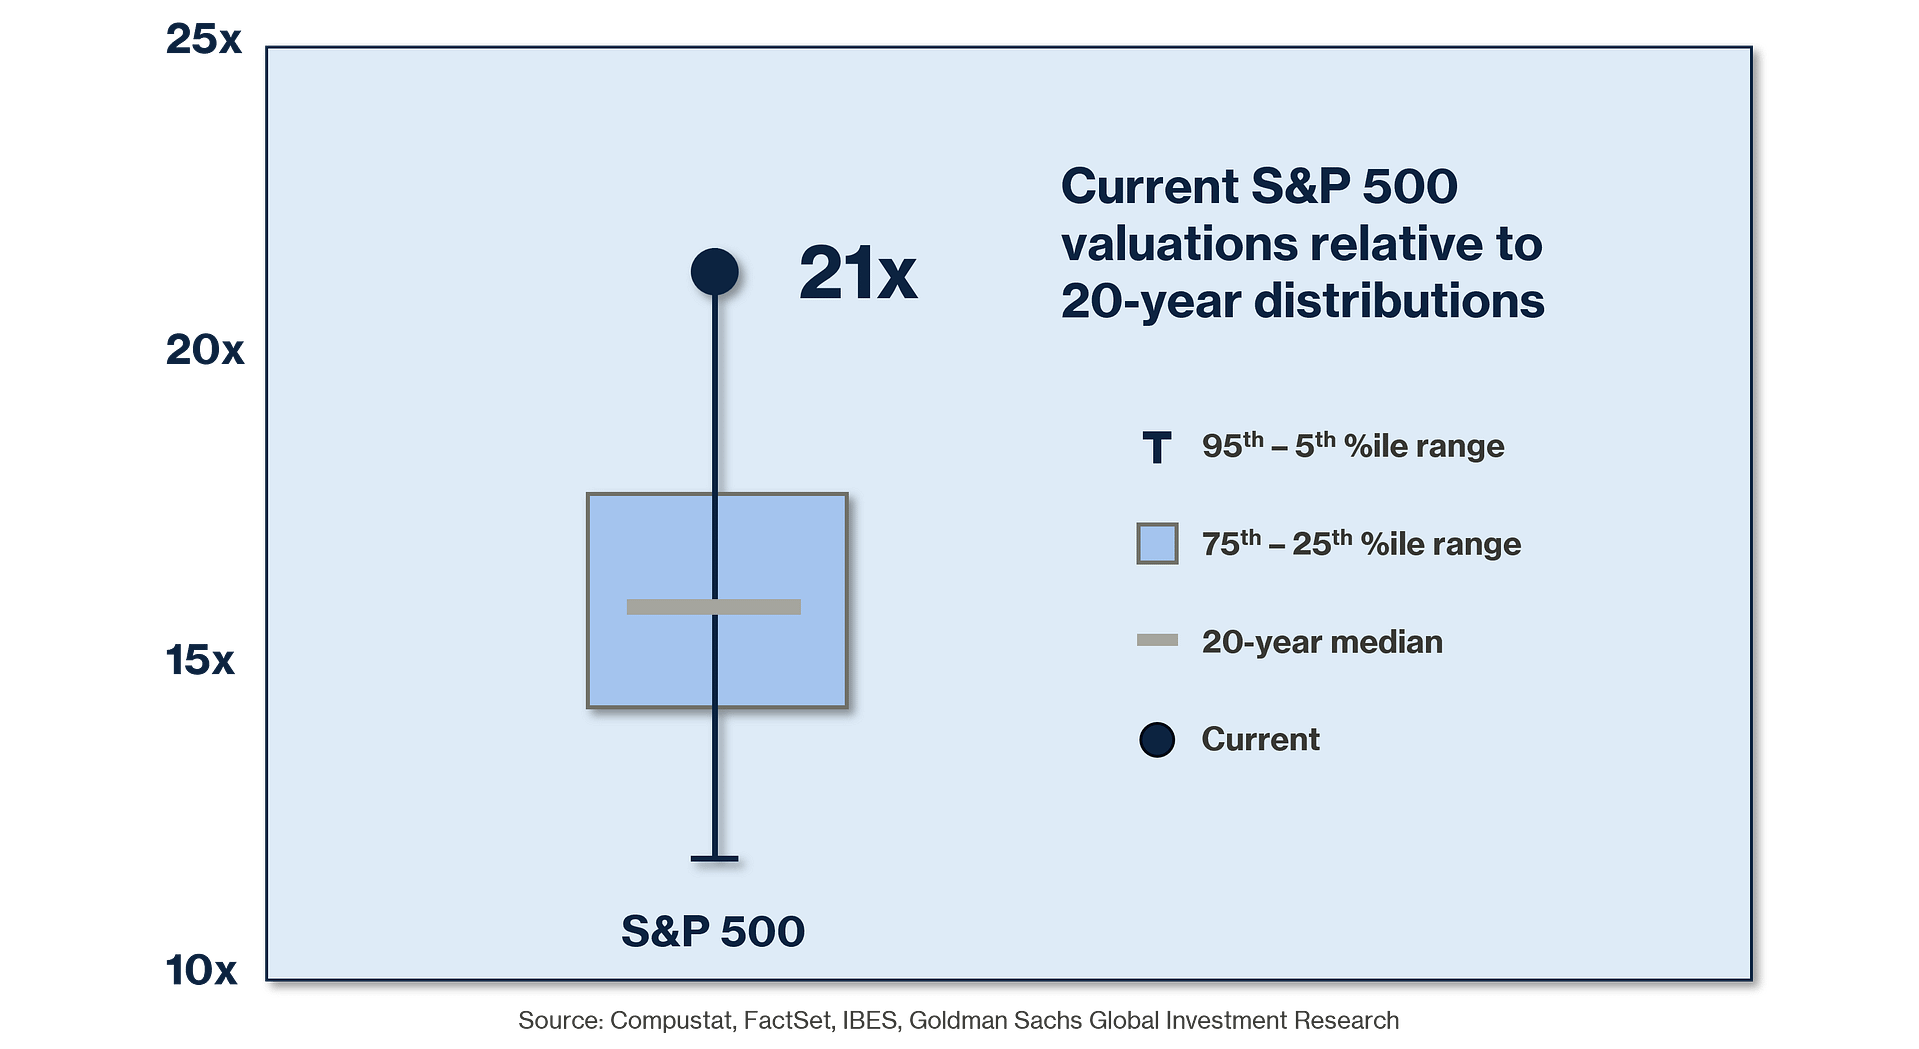
For those that want a more academic chart, here is one that shows the statistical make up of past years, relative to where we are now:
Naturally, the level of valuations has us very concerned. The market can absolutely continue to go up in price, but the level of risk is very significant, especially if the economy slows. Part of this is due to the immense concentration of the S&P 500 index, with the largest 10 companies of the 500 now representing more than 38% of the entire market capitalization. As we all understand from 2022 (and April of this year) when those 10 volatile stocks start to decline it can become a self-fulfilling snowball effect. The other concern comes from how so much of the index is valued based on a sales metric as opposed to profit metric. Metrics like Price/Sales can move very quickly, especially if they are sky high. Again, think back to 1999, 2020, 2022, April of 2025, and painful memories will come into focus about how quickly the “animal spirits” can reverse and some stocks can drop very quickly. Naturally, if those metrics/stocks make up a large percentage of the index the pain will be felt by all those who are invested in that index. So, just how much of the index is trading at extreme Price/Sales ratios….?
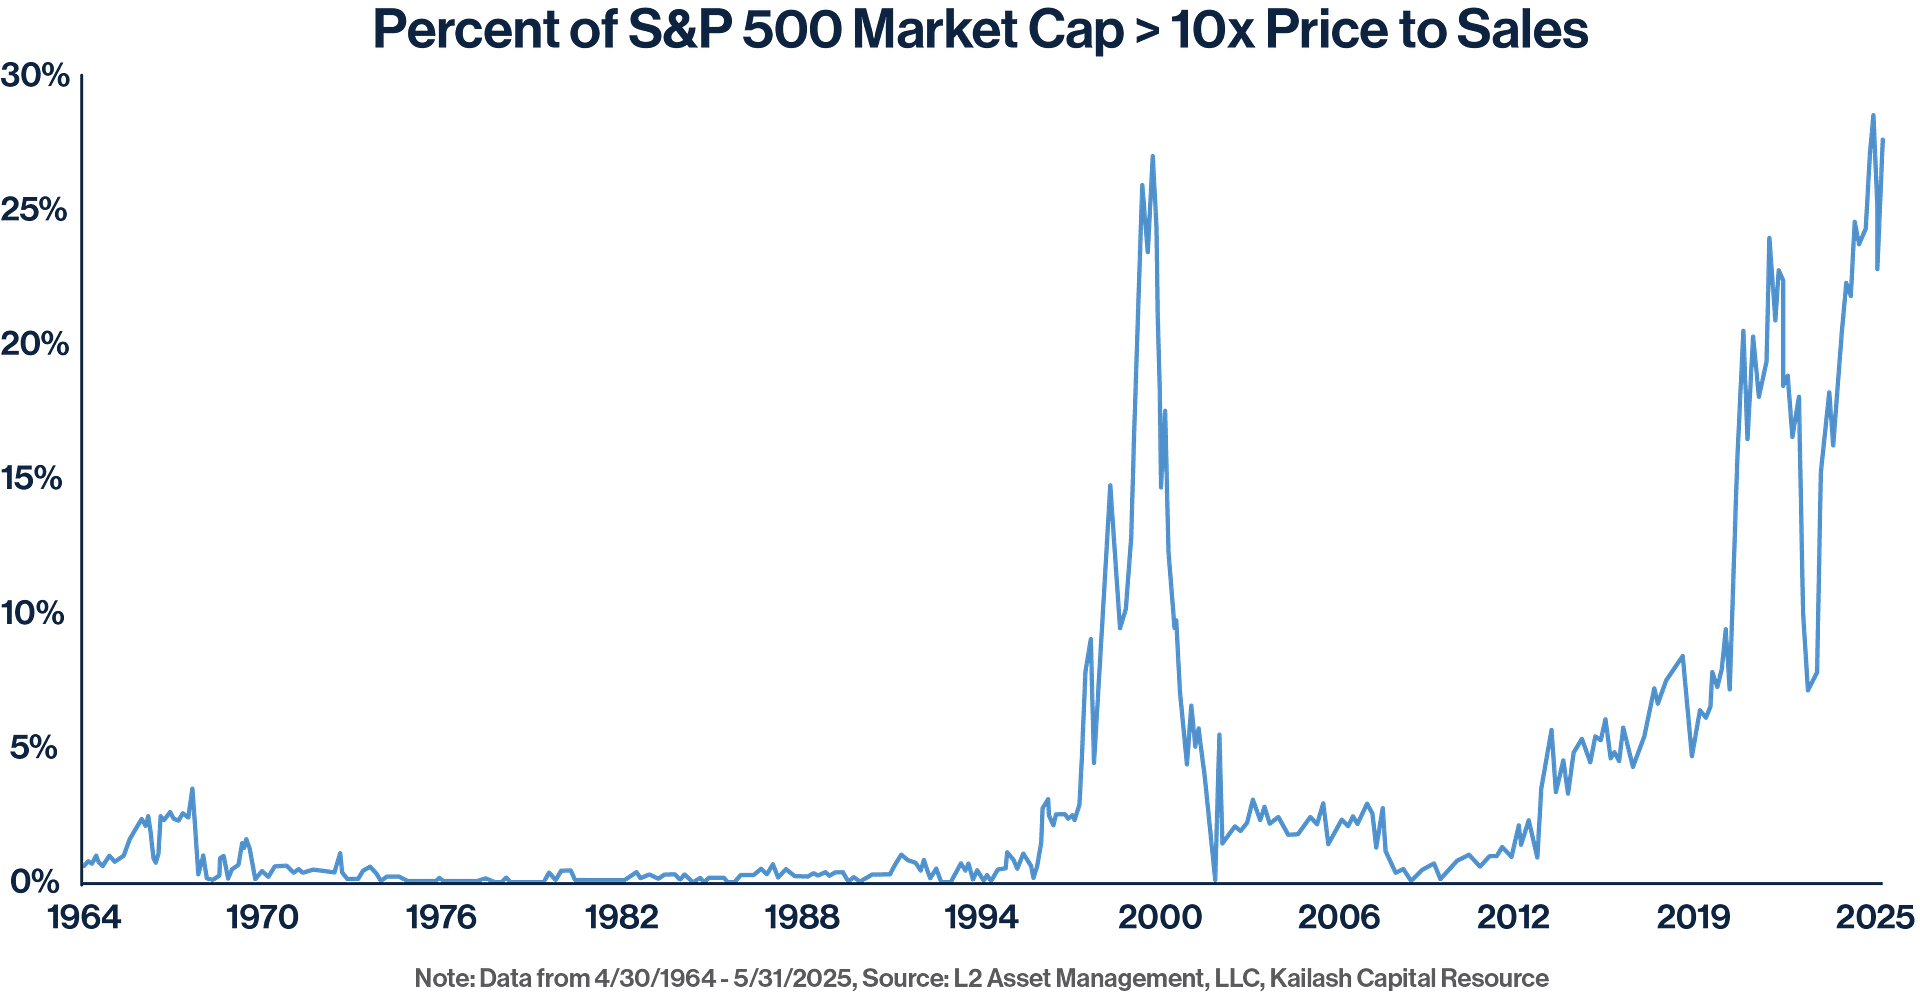
Yes, you are reading that chart correctly, more than 25% of the entire market capitalization of the S&P 500 is trading at greater than 10 times SALES! We would guess most readers of this letter would be more than happy to sell their company if someone offered them 10 times revenue!
Of course, we would be remiss if we did not mention that the only two times this metric has reached such an extreme level was during the tech bubble of 1999 and the mania that was 2021… both did not end well and we do not have a reason to believe that “this time will be different…”
But the Consumer Will Come to the Rescue… or Will They?
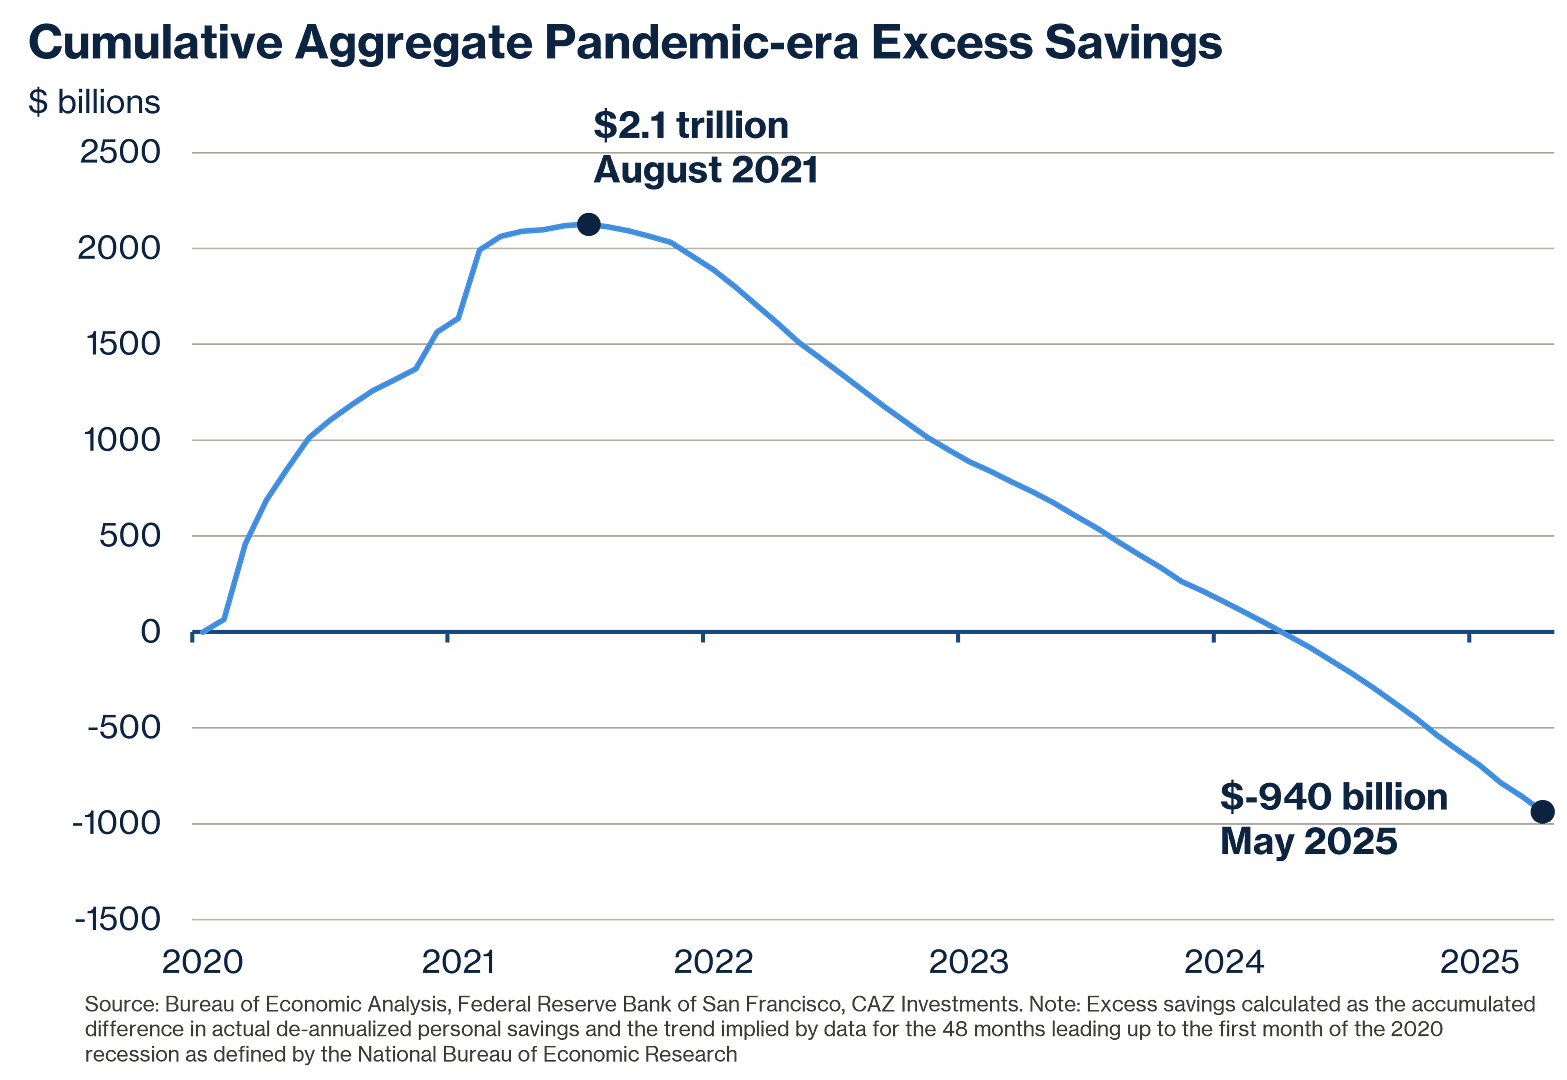
Much has been written about how the economy is fine and the President is going to make sure that it stays that way, using every resource he has available. We believe that he indeed will do that, and he has levers to pull that are impactful. That said, the health of the consumer is deteriorating for reasons that have little to do with this President’s tenure. Simply stated, the economic cycle is beyond the control of any person or administration. The immense increase in personal balance sheet liquidity that was created during and after covid has completely dissipated as consumers got used to buying almost anything they wanted, any time they wanted it, even though their income was not keeping up with their spending.
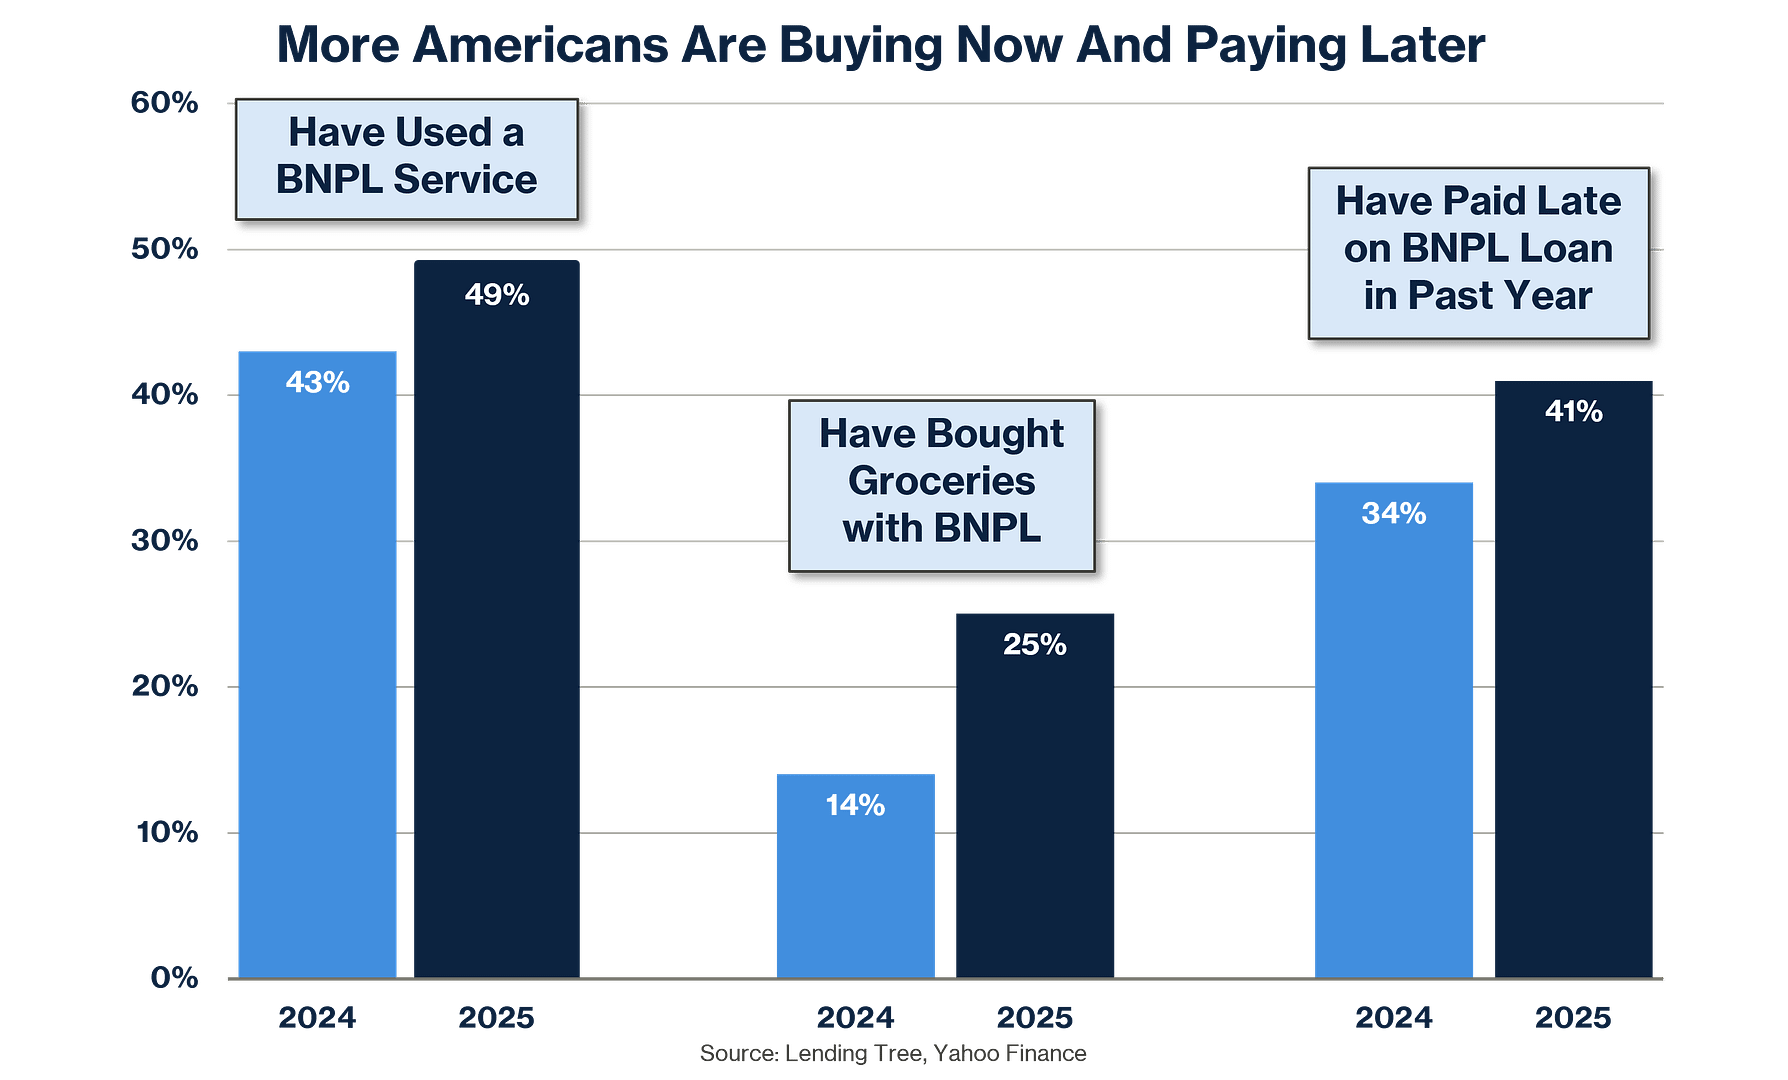
Further, now that consumers do not have cash swashing around in their bank accounts and higher mortgage rates have made it harder to constantly refinance their homes to unlock liquidity, they are getting more and more in debt, borrowing against their future earnings via credit cards, car loans and one of the fastest growing trends, “BNPL”, otherwise known as buy now pay later. The data around consumer credit is disconcerting across the board, but this latest trend is one that makes us very uncomfortable, as 41% of users report being late on a BNPL payment in the last year:
The ability for consumers to continue to feed the economy is significantly less than any time we have seen since before the financial crisis. The result of this trend is that it will take job growth, and lots of it, to offset the decline in the ability for consumers to just “feel good and buy stuff.”
Unfortunately there are headwinds that are causing many companies to reconsider their desire to add a lot of new workers to their payroll:
- Uncertainty around tariffs – regardless of how the “game of chicken” plays out, companies that might be impacted are going to be cautious about adding expenses until they feel the coast is clear.
- Long-term interest rates remain stubbornly high, which is causing more cash flow to be redirected to debt service.
- This thing called Artificial Intelligence, perhaps you have heard of it…., is causing employers to seriously evaluate whether they actually need more people or not. They may, but they are going slow to determine with more accuracy how many new hires they want to make, while not replacing a lot of natural attrition. Yes, AI is incredible, but it absolutely makes us wonder, “what we are going to do with all these peoples?”
To drive home the point on #3, here are a few excerpts from a recent Wall Street Journal article:
“Artificial intelligence is going to replace literally half of all white-collar workers in the U.S.,” Ford Motor Chief Executive Jim Farley said in an interview last week with author Walter Isaacson at the Aspen Ideas Festival. “AI will leave a lot of white-collar people behind.”
“At JPMorgan Chase, Marianne Lake, CEO of the bank’s massive consumer and community business, told investors in May that she could see its operations head count falling by 10% in the coming years as the company uses new AI tools.”
“Professionals will need to accept the reality that few roles will be unchanged by AI, Micha Kaufman, CEO of the freelance marketplace Fiverr, wrote in a memo to his staff this spring.
“This is a wake-up call,” he wrote. “It does not matter if you are a programmer, designer, product manager, data scientist, lawyer, customer support rep, salesperson, or a finance person—AI is coming for you.”
“Shopify Chief Executive Tobi Lütke recently told workers that the company wouldn’t make any new hires unless managers could prove artificial intelligence isn’t capable of doing the job.”
In the interest of brevity we will not belabor this point, but we are really, really concerned about the transition period coming. At this point we do not have a good working thesis as to what we are going to do with all the displaced/unhired workers… We will plan to cover this topic in more detail in a future letter, as we hopefully get some clarity.
Where Does All That Leave Us?
The good news is there are some really interesting opportunities presenting themselves right now, and that is where we believe investors should be focused. The challenging news is that it is very hard for us to get excited about traditional stocks and bonds. At this point, we remain concerned about valuations and earnings growth in the public markets and are a “1” on the CAZ Scale. We firmly believe that the risk/reward profile of traditional risk assets is not very favorable.
After posting last quarter, we felt it would be helpful for all readers to provide this commentary about how to use the CAZ Scale a second time. Our analysis indicates that nearly all readers engage with at least half of our quarterly letters. Therefore, by presenting this information here, we aim to ensure it reaches the entire audience.
We have received numerous inquiries from investors and the media regarding how they should interpret changes to the scale. Therefore, we believe it is beneficial to provide some historical context. As we have emphasized over the past 24 years, the CAZ Scale is not intended to be a market timing tool. Its purpose is to inform asset allocation decisions by indicating how we are positioning our personal capital within the parameters of our target asset allocation.
For instance, if an institution’s investment policy statement requires stock exposure between 40% and 65%, they must decide where to position themselves within those limits. The CAZ Scale was designed to assist in making that decision. For example, if the CAZ Scale is at a 1, we would suggest the investor maintain minimum exposures, between 40-45% in stocks. A rating of 2 indicates a range of 45-50%, a 3 corresponds to 50-55%, a 4 indicates 55-60%, and a 5 signifies maximum exposure of 60-65%.
This methodology can be applied irrespective of the allocation bands’ width. We know of several large family offices that use our scale within their flexible mandate that ranges between 50% and 150% of stock exposure. Regardless of the bands employed by an investor, adhering to this approach should help them uphold a disciplined rebalancing program. This ensures that decisions are based on fundamentals and valuations rather than being arbitrary.
With that, where are we allocating our personal capital and where should investors be exploring opportunities? Most all we see that is compelling right now is in the private markets. These are the key Themes we are focused on:
- The Energy Evolution
- The Growth of Private Markets
- The Void Left Behind by Regional Banks
- The Changing Consumer/Cord Cutting
- Disruptive Technology
If you have not spoken to a member of our Team about the vehicles we built specifically to benefit from those Themes, please do so and we will provide you with the details.
The significant dislocation that is occurring in the secondary markets is creating what we believe to be a very unique edge for our firm. Due to the continued slower than normal fundraising and exit environment the volume available to us of both LP-led and GP-led secondaries is the largest we have ever seen. (LP-led = an existing limited partner is selling a position. GP-led = a general partner is creating a continuation vehicle or other mechanism to hold onto some of their existing assets)
Our focus on the core Themes mentioned above provides us with the ability to act quickly and with scale on the inventory that comes our way via the secondary market. The result has been the ability to acquire positions at compelling discounts which provide us with exceptional entry points into what we believe to be very attractive investments. We expect this trend to remain for several quarters and that should enable us to deploy significant amounts of capital into assets that we anticipate will generate excellent rates of return.
Summer is winding down and it is almost time to disclose several projects that have been in the “laboratory,” some for multiple years. Stay tuned for the details and when our Team reaches out, please be responsive as many of these situations will have a finite time horizon. It is going to be an incredibly busy fall!
We are grateful for your partnership and look forward to hopefully seeing each of you sometime between now and our Themes for 2026 event, which will be held over two days for the first time, January 27th and 28th. Please plan to arrive in Houston on the morning of the 27th as we will have excellent content for all investors that afternoon. Because of the profile of our speakers, and the fact that this will be the 10th anniversary of Themes and the 25th anniversary of CAZ, we expect to hit a wait list sooner than normal. Please reserve your spot as soon as you receive the invitation! We hope you have an outstanding fall.
All our very best!
The CAZ Investments Team