Quarterly Letters & Insights
CAZ Investments Quarterly Letter 2026 – Quarter 1
Is the Market in Denial?
Twenty-five years ago, CAZ was founded to do one thing well: protect and compound capital over long periods of time, with uncommon discipline. We have written these letters through recessions, financial crises, global pandemics, wars, and periods of irrational exuberance in all directions. If there is one lesson that runs like a thread through every one of those letters, it is this: what investors choose to ignore is almost always more dangerous than what they choose to worry about.
As we close the books on the first quarter of 2026 and survey the landscape before us, that lesson comes to mind immediately. The world has delivered several very clear signals in recent months. A conflict in the Middle East that sent energy markets into their most violent single-quarter move in decades. A labor market visibly and measurably restructuring itself in ways the headline numbers do not capture. A stock market hitting new highs on the strength of an increasingly narrow group of companies, while the dividend investors collect has rarely been lower in 100 years of recorded data. And a private credit market generating more noise than signal, where nuance matters enormously but is routinely lost in the headlines.
None of these are small things. This letter gives each the detailed examination it deserves. Our goal, as it has always been, is to share what we can assess with a high degree of confidence, how we interpret the current data, and most importantly, how we are allocating our personal capital.
We remain firmly at a “1” on the CAZ Scale. The risk-reward profile of broad-based traditional risk assets is, in our view, deeply unattractive.
I. The War the World Has Stopped Worrying About
Writing this letter has actually been one of the hardest things to do over the last 25 years. Every time we start, it seems like the story changes dramatically enough that the letter is going to be obsolete before it is even sent to investors. We finally are at a place to where we want to get this in your hands and so we charge forward knowing that things could be materially different potentially within the next few days or weeks.
On February 28, 2026, the United States and Israel launched coordinated strikes on Iran, targeting nuclear and military infrastructure. Within days, Iran declared the Strait of Hormuz effectively closed to Western-allied shipping. Tanker traffic collapsed. On March 7, a single commercial vessel transited the Strait. The historical daily average is 138 ships.
What happened next in the oil market was, by any historical measure, extraordinary.
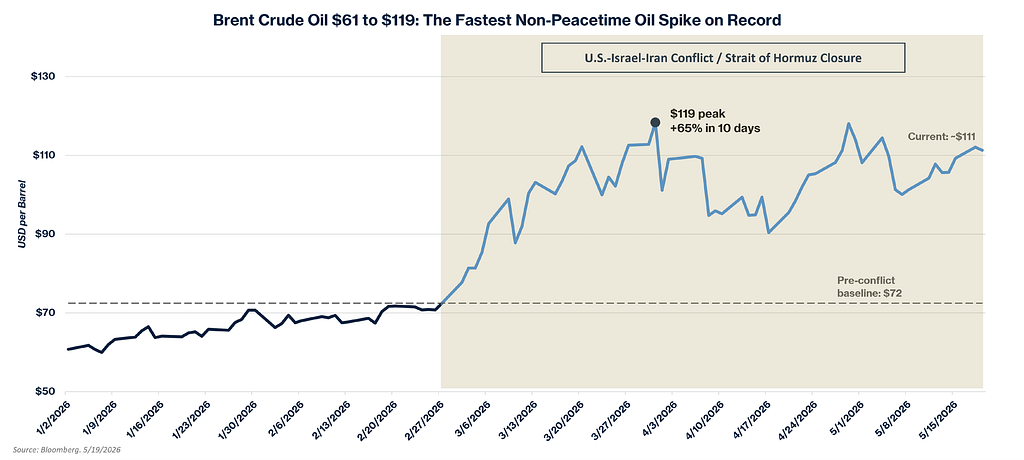
Brent crude began 2026 at $61 per barrel. After rising tension pushed prices to $72 by February 27, the conflict triggered the single largest quarterly oil price increase on an inflation-adjusted basis since at least 1988, per the EIA. Prices reached nearly $120 per barrel at their peak — a 65% increase in less than two weeks. March 2026 was one of the largest single-month oil price surges on record, with Brent gaining 51% in the month alone. As of this writing, Brent trades around $111. The Strait remains effectively closed. The IEA has warned the market could remain materially undersupplied through October even if a resolution is reached next month.
Let us be precise about what the Strait of Hormuz means in practical terms, because many investors underestimate it.
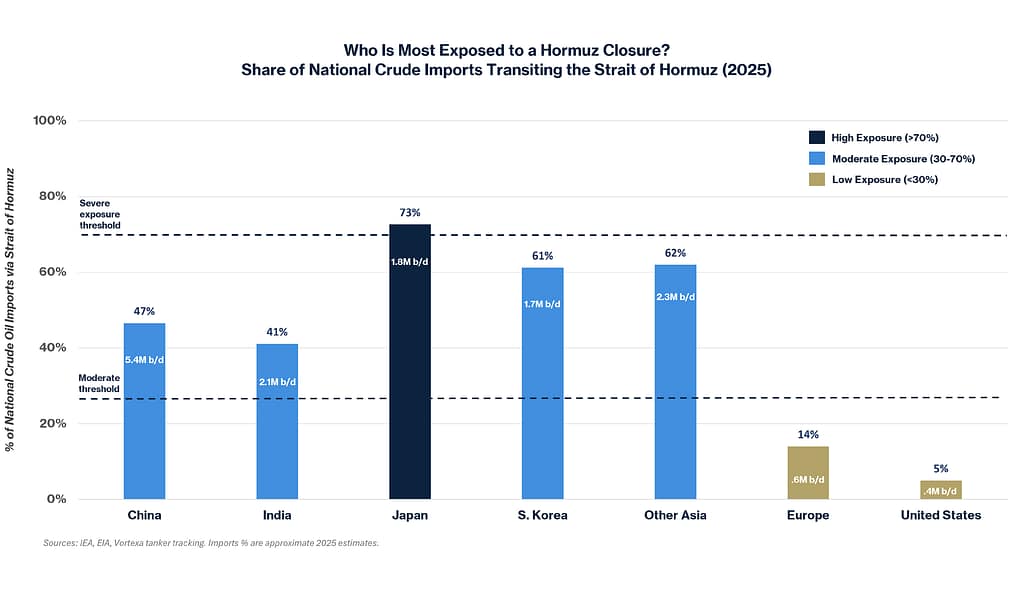
In 2025, approximately 20 million barrels of crude oil and petroleum products transited the Strait of Hormuz every single day — roughly 25% of all global seaborne oil trade and about 20% of total world petroleum consumption. Japan imports approximately 73% of its crude from the Middle East, the majority flowing through Hormuz. South Korea sources 61% of its imports through the Strait. India, 41%. China, the world’s largest oil importer, receives nearly half of its crude via Hormuz. The United States, by contrast, imports roughly 5% of its total petroleum consumption through Hormuz today — down from over 20% fifteen years ago as domestic shale production surged. This is the discrepancy we described in our March 2026 video update to Partners. Americans feel this crisis primarily at the gasoline pump. People in Japan, China, South Korea, and India are living a fundamentally different version of this story.
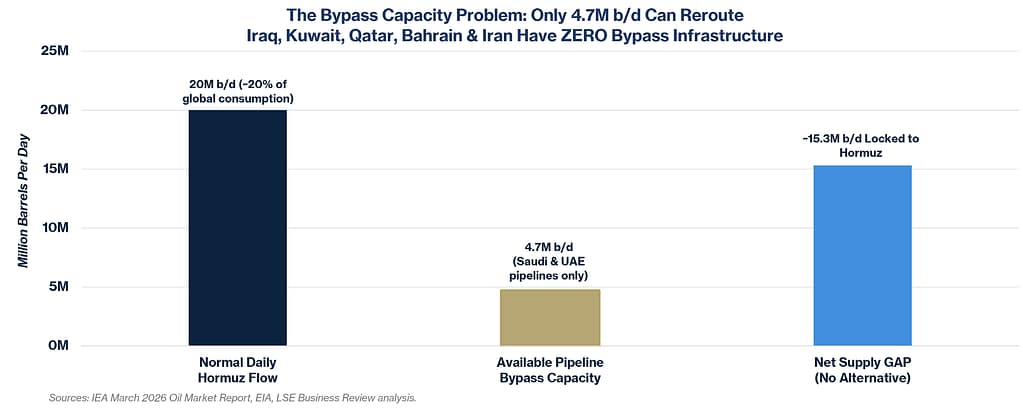
The bypass problem makes the situation structurally fragile. Saudi Arabia’s East-West pipeline and the UAE’s Abu Dhabi Crude Oil Pipeline together can handle, at maximum, approximately 3.5 to 5.5 million barrels per day. Five countries — Iraq, Kuwait, Qatar, Bahrain, and Iran — have zero meaningful bypass infrastructure. With 14 to 16.5 million barrels per day locked to this single four-mile-wide passage, the IEA has called this the largest supply disruption in the recorded history of the global oil market.
The Three Layers of Economic Damage
Layer One: The Commodity Tax. Every dollar per barrel above pre-conflict levels is a direct cost that impacts consumers and businesses. U.S. average retail gasoline hit $3.99 per gallon by March 30. Diesel reached $5.40. For a consumer already under financial stress, these are not trivial numbers. The spike in inflation also puts the Central Banks around the world in an even larger predicament, as they would like to lower interest rates to aid the economy, but that could ignite even more inflation pressures. Once again, the Federal Reserve is “In a Box.”
Layer Two: The Uncertainty Premium. Sustained geopolitical risk delays decisions. Capital expenditure approvals get postponed. Hiring freezes get implemented as precautions. Acquisition discussions extend timelines. Aggregated across thousands of companies globally, these individual pauses become economic drag before they become a formal recession.
Layer Three: The Global Discrepancy. When Japan, South Korea, India, and Germany are operating in crisis mode, the United States is not immune from the consequences. Europe’s business confidence surveys tell a measurably more cautious story than their American counterparts. The insulation the United States enjoys does not mean the risks are contained. It means we may be among the last to feel them.
“This is still the largest oil supply shock in the history of the oil market.” — Rory Johnston, Commodity Context, April 2026
II. The Hollowing Out Continues
In our 3Q 2025 letter, we introduced the concept of the Hollowing Out of the American Workforce — a structural, AI-driven reshaping of white-collar employment concentrated squarely in the middle of the income ladder. We said then that this was no longer theoretical. The first four months of 2026 have made the case more forcefully than any letter we could write.
The Numbers
Total U.S. layoffs in the first four months of 2026 reached approximately 300,749, according to outplacement firm Challenger, Gray and Christmas. That is 50% lower than the same period a year ago, when government workforce reductions dominated the conversation, and private-sector layoffs were 10% below the prior year. Reassuring on the surface. Look beneath it and the picture changes entirely.
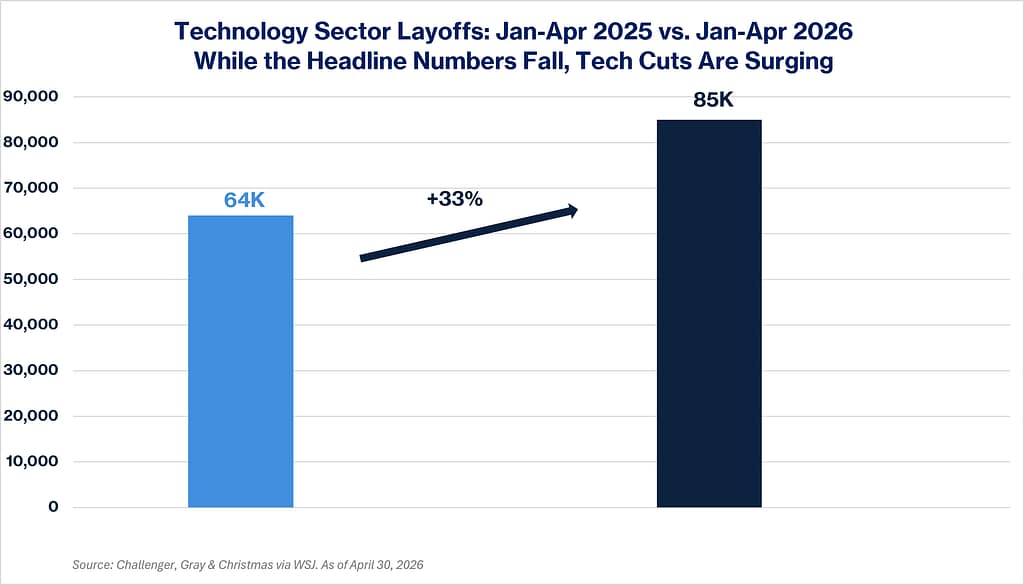
Technology companies eliminated more than 85,000 positions in the first four months of 2026 alone — a 33% increase over the same period in 2025. And critically, the companies doing this are not in distress. They are posting record revenues. They are profitable, well-capitalized organizations making deliberate, premeditated decisions about how much human labor their AI-augmented operating models require.
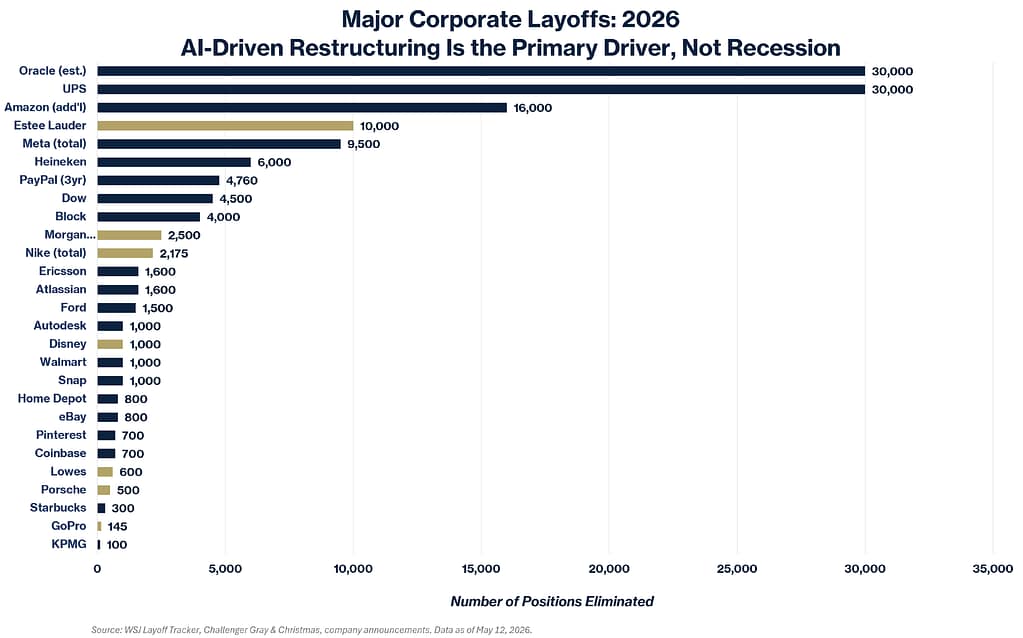
The Cisco Moment: Record Revenues, Thousands of Layoffs, Stock at All-Time Highs
On May 14, 2026 — just days before this letter was finalized — Cisco Systems delivered one of the clearest illustrations of the structural shift we have been describing. Cisco reported $15.8 billion in revenue for its fiscal third quarter, a 12% year-over-year increase that beat Wall Street estimates. Product revenue rose 17%. The company raised its full-year guidance to $62.8–63 billion, up from $56.7 billion the prior year. Its stock, already trading at record highs, jumped more than 16% on the news.
Simultaneously, Cisco announced nearly 4,000 job cuts, less than 5% of its total workforce, but a significant number nonetheless, especially to those 4,000 families. CEO Chuck Robbins sent employees a publicly shared email explaining the rationale. The logic was unambiguous:
“The companies that will win in the AI era will be those with focus, urgency, and the discipline to continuously shift investment toward the areas where demand and long-term value creation are strongest. This means making hard decisions — about where we invest, how we’re organized, and how our cost structure reflects the opportunity in front of us.” — Chuck Robbins, CEO, Cisco Systems, May 14, 2026
Read that carefully. Cisco is not cutting people because business is bad. Cisco is cutting people because business is so good that it has the confidence to reallocate the capital those salaries represented toward AI investment. The company explicitly plans to expand its secure AI factory with Nvidia. The company directly cited “robust demand for AI infrastructure” as the driver of product revenue growth.
The Cisco CEO follows in the footsteps of Block CEO Jack Dorsey, who cut 40% of his workforce while saying AI tools had changed how to run a company. And Atlassian’s CEO, who called it disingenuous to pretend AI does not change the number of roles a company requires. These are not euphemisms. They are CEOs of healthy, growing businesses explaining precisely why they need fewer people.
The Question Nobody is Asking
Here is the question that we believe deserves more attention than it is receiving in the financial press: if companies are letting people go in order to invest in AI, and that AI investment is generating productivity gains that eliminate the need to rehire, what would cause a new cycle of hiring to begin?
In prior technology cycles, the answer was straightforward. Automation of one category of work created new categories of work. The ATM eliminated some bank teller roles but created more branches, more loan officers, and more customer service roles. The spreadsheet eliminated some accounting positions but created more financial analysts. The pattern held across nearly every wave of productivity technology in modern history: displacement in one area created demand in another.
The AI cycle may be different in a critical way. Prior technology tools were instruments — they required human operators to deploy them. AI is beginning to operate as a collaborator, capable of handling the very coordination and judgment tasks that created white-collar employment in the first place. When a company like Cisco can grow revenue 12% year-over-year while cutting headcount, and its stock rises 16% in a single day on that news, the market is sending a clear message: investors are rewarding the trade of people for AI, not questioning it.
This is not a prediction that human employment will end. It is an observation that the mechanism which historically drove rehiring, growth creating new categories of needed work, is under pressure in a way it has not been before. Until that question has a clear answer, the hollowing out of the American middle class white-collar workforce is a structural concern, not a cyclical one.
These are not struggling companies making desperate cuts. These are thriving companies making strategic ones. The difference matters enormously for what comes next.
III. A Market That Has Stopped Asking the Hard Questions
The S&P 500 has continued to reach for new highs. We ask, as we always do: who is doing the work?
The Concentration Problem
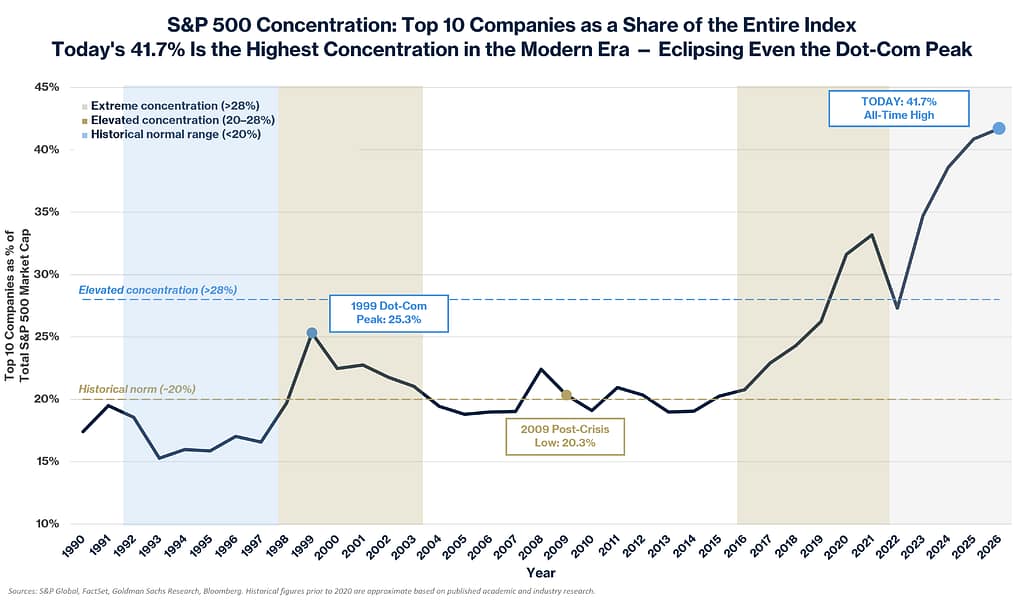
The chart above tells a story that a single data point cannot. Today’s top 10 companies represent 41.7% of the entire S&P 500 — a level of concentration that has no modern precedent. At the dot-com peak in 2000, widely regarded as the most concentrated and speculative market of the modern era, the top 10 represented 25.3% of the index. We are now more than 16 percentage points above that prior extreme.
To put it differently: investors who today buy a simple S&P 500 index fund are placing more than a third of their capital in just ten companies. The other 490 companies in the index share the remaining 61.6% of exposure. And those ten companies are overwhelmingly AI-beneficiary names trading at valuations that price in decades of flawless execution. More than 62% of the S&P 100 trades at greater than 30 times earnings. Only 5 of the 100 largest companies in America trade below 10 times earnings.
The Breadth Warning
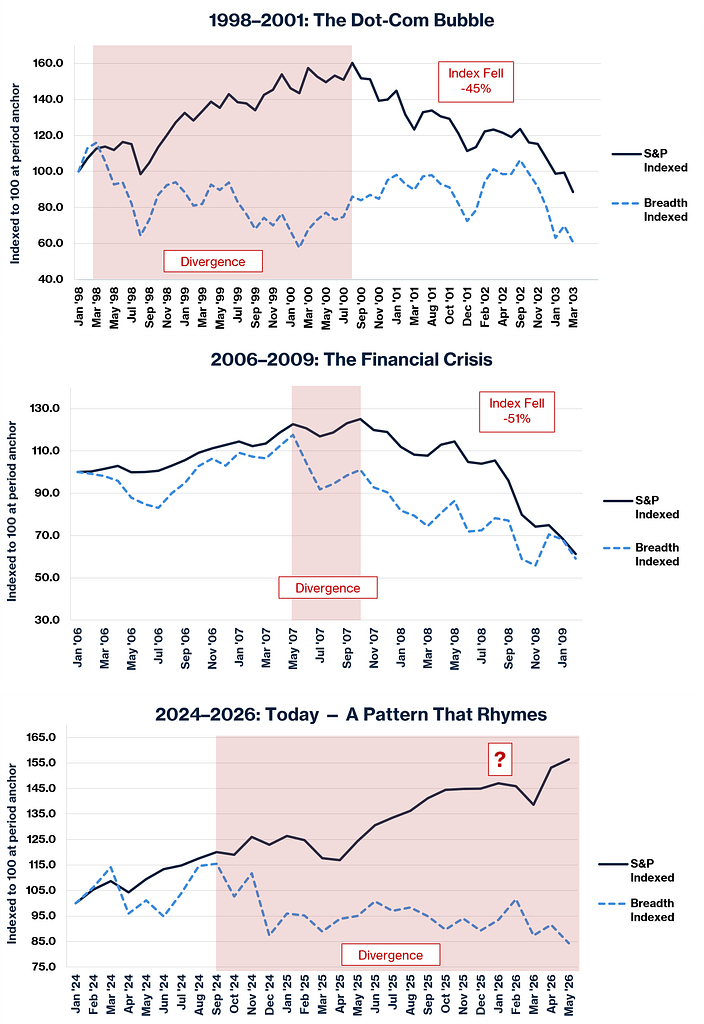
Sources: S&P 500 historical A-D data, S&P 500 monthly closes.
The advance-decline (“A/D”) line measures actual participation of individual stocks in any market move. When the A/D line declines even as the major indices make new highs, it signals that the index is being carried by a handful of large-cap names while the majority quietly deteriorates beneath the surface.
History has given us two unmistakable examples of where this can lead. In 1999, the S&P 500 A/D line peaked long before the S&P 500 crashed 45%. In 2007, the A/D line peaked approximately six months before the top that preceded the Financial Crisis peak-to-trough decline of 51%. Today, the S&P 500 makes new highs while the underlying advance-decline picture fails to confirm the move. We are not predicting an outcome. We are observing that the internal structure of the current rally carries the fingerprints of both prior market peaks. History does not repeat exactly — but it has an uncomfortable tendency to rhyme.
The Dividend Yield Signal: 100 Years of Context
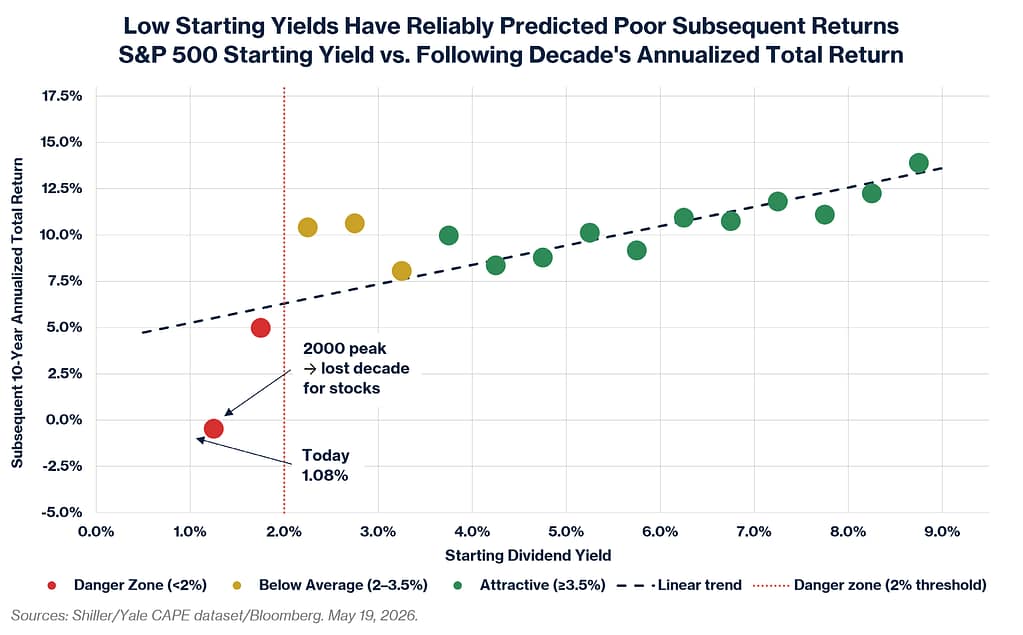
The S&P 500 dividend yield stands at approximately 1.08% as of this writing — the lowest in recorded history. The prior low was approximately 1.1%, reached briefly in 2000. The 100-year historical average is 3.8%. The developed world ex-U.S. yields 2.8%. The 10-year U.S. Treasury bond yields more than 4.5%. An investor today collects a nearly risk-free return of 4.5% from government bonds versus a dividend yield of 1.08% from equities, where they are taking on dramatically more volatility and concentration risk. That is not a normal relationship.
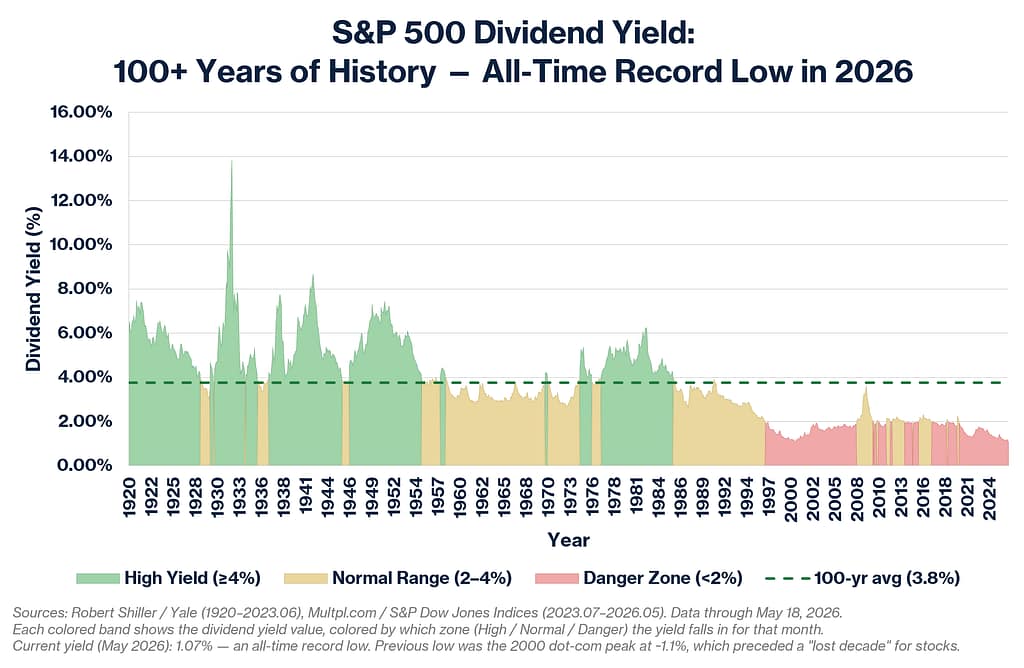
The relationship between starting yield and subsequent decade returns is one of the most durable patterns in financial history. Those who bought near the 1.1% yield level in 2000, the last time we were here, experienced the Lost Decade, with the index delivering negative price returns through 2010. We are now at an all-time record low yield. We are not predicting another Lost Decade. We are saying the starting conditions are as unfavorable as they have ever been.
The CAZ Scale remains firmly at a “1.” By virtually every historical measure we can assess, the risk-reward profile of broad-based traditional risk assets is deeply unattractive.
IV. Do Not Paint with Too Broad a Brush – Private Credit Is Not a Monolith
We have received many questions about private credit. The topic is being discussed in the popular press in ways that generate more heat than light, and we will attempt to provide some clarity.
What is Actually Happening
The headlines are not wrong that risks exist. Defaults are rising in some segments. Some borrowers are struggling and we are particularly concerned about the consumer. The rapid growth of private credit over the last decade has inevitably produced some loans underwritten more aggressively than the underlying cash flows warranted. That is true, and anyone who tells you otherwise is not being straight with you.
What is not true is the inference that often follows: that private credit is broadly impaired, that every manager faces the same exposure, and that the category should be approached with uniform caution. That conclusion is too simple, and acting on it indiscriminately would be a mistake.
Who is Actually Defaulting
Most high-profile defaults have not come from AI-disrupted software companies. They have come from fraud, businesses that became over-levered relative to cash flows, companies led by management teams that lacked the skill to navigate a higher rate environment, and situations where capital was deployed
without adequate discipline. These are lending failures — specific, identifiable, and largely avoidable with thorough due diligence.
The AI disruption question in enterprise software is real and worth monitoring carefully. But the question of who wins and who loses in that reshaping will not be answered this quarter, or this year. For lenders underwriting to yesterday’s growth rates, this creates risk. For lenders underwriting to today’s cash flows and today’s collateral values with appropriate structural protections, the picture is fundamentally different. They share a category name. They do not share a risk profile.
Not all private credit is equal. The analysis required to distinguish between them demands looking at individual loan portfolios, borrower by borrower, lender by lender — not reading headlines.
At CAZ, we have spent 25 years acquiring the expertise to make those distinctions. We exited nearly all our private credit exposure at the end of 2024, simply because we just did not see a favorable risk/reward. Today we are becoming more interested in what we are seeing and will consider episodic opportunities where there is material mispricing. The current environment is producing some attractive entry points in specific segments, precisely because the broad-brush narrative is causing some investors to panic and leave opportunity behind.
V. We Are Building
Earlier this year, we celebrated our 25th year and the opening of our new headquarters. Last month we shared a detailed update with Partners on initiatives to drive significant enhancements to our fund operations and investor experience. We look forward to sharing with you the first fruits of that labor, which has been an all-consuming lift for our Team, in the next few months.
The changes we are making reflect a deliberate, years-in-the-making effort to be an even better partner to our 9,000+ investors across all 50 states and 43 countries. We have significant initiatives planned for summer and early fall and look forward to sharing them as they come to fruition. We continue to operate with the mindset that we are a 25-year-old startup.
Please help us accomplish these objectives by referring world-class talent to us. We are adding to our Team in every department, and you likely know or work with people in the industry who are outstanding at what they do and would be cultural fit for us. Help them connect with us so they can discover how they can strive to develop into the very best version of themselves they can be, by becoming a member of the CAZ family.
We invest our personal capital first in everything we do, alongside yours. The CAZ Scale, these letters, the phone calls, the Themes events — they are all expressions of the same commitment we made in August of 2001: to be honorable, disciplined, and aligned in everything we do.
The world is complicated right now. Markets are pricing in a degree of calm that we do not believe the underlying data supports. That does not mean the next move in markets is down, or that it happens tomorrow. It means this is not a moment for complacency.
We are grateful for the trust you place in us. We are excited about what this firm is becoming. Our best work is ahead of us.
All our very best,
The CAZ Investments Team