

Quarterly Letters & Insights
CAZ Investments Quarterly Letter 2026 – Quarter 2
The Fed Is In a Box, Still, and Likely Worse Now…
Markets rebounded quickly in the second quarter, after the significant decline in March. Despite the very significant “noise” on the geopolitical front, the market’s animal spirits came back en masse, creating a sharp rally and renewed discussions about a “bubble” in certain segments of the technology sector. If one removes all the “trees” and focuses on the “forest,” what is clear is that not much really changed in the first half of the year. Candidly, there is a lot more that “remains the same” as opposed to a lot of new changes. The economy remains cautiously resilient, inflation remains stickier than most would prefer, interest rates remain elevated, stock market concentration remains at unprecedented levels, and valuations remain uncomfortably high in many areas.
In our first quarter letter, we described a ceasefire in the Middle East that appeared to be holding, a labor market being reshaped by artificial intelligence in ways the headline numbers do not capture, and a stock market reaching new highs on the back of an increasingly narrow group of companies. We closed that letter uncertain whether the calm would last. It did not. The second quarter did not introduce new problems. It delivered updated, and in some respects more serious, versions of the same.
We remain firmly at a “1” on the CAZ Scale. The risk-reward profile of broad-based traditional risk assets is, in our view, deeply unattractive.
I. The Ceasefire That Did Not Hold
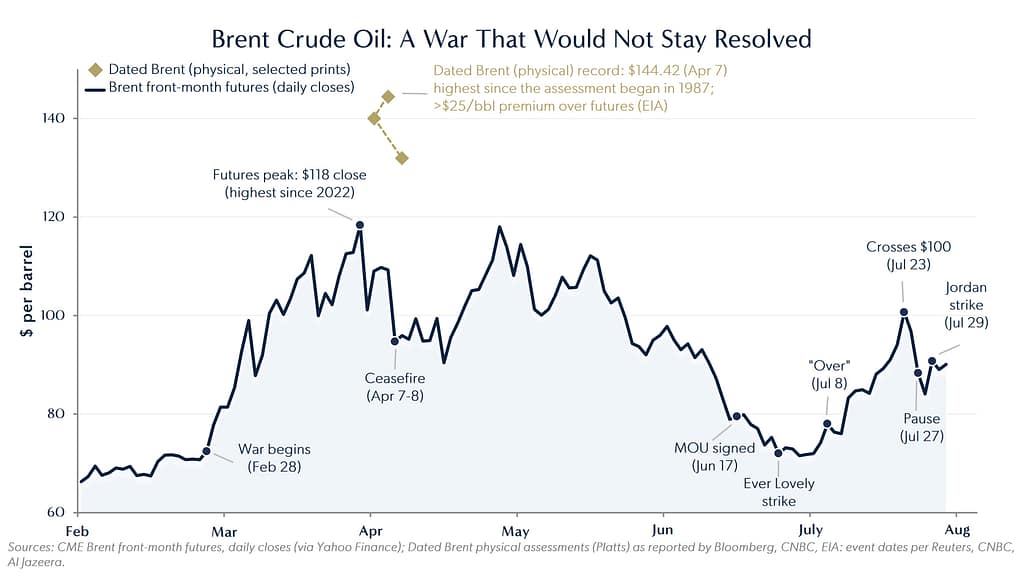
This war began on February 28, 2026, when U.S. and Israeli airstrikes targeted Iran, which then responded with missile and drone strikes against Israel, U.S. bases, and U.S.-allied states across the region, and closed the Strait of Hormuz to shipping. Fighting escalated through March, disrupting one of the world’s most important energy corridors and, by the International Energy Agency’s account, producing the largest supply disruption in the history of the global oil market. Brent crude oil futures, which had traded in the $70s before the war, peaked near $118 per barrel at the end of March, their highest level since 2022. The physical market told an even starker story. Dated Brent, the benchmark used to price the majority of the world’s seaborne crude, surged past $140 in early April and printed a record $144.42 on April 7th, the highest level since the assessment began in 1987, reflecting an unprecedented premium of more than $25 per barrel over futures as buyers scrambled to secure barrels trapped behind the closed Strait. The paper market was pricing the hope of a ceasefire; the physical market was pricing the scarcity of actual barrels. In our view, that divergence, the largest on record, says more about the severity of this supply shock than either number does on its own.
On April 7th and 8th, the U.S. and Iran agreed to a two-week ceasefire, brokered by Pakistan, tied to a reopening of the Strait. Oil prices fell sharply on the news, with Brent falling as much as 16% intraday and settling 13% lower. The relief did not last. Direct talks between the two sides in Islamabad on April 11th and 12th collapsed, and on April 13th the U.S. imposed a full naval blockade on Iranian ports, which remained in place for six weeks.
A more durable framework followed on June 17th, when the U.S. and Iran signed a 14-point memorandum of understanding intended to end hostilities on “all fronts, including in Lebanon,” lift the U.S. blockade, and reopen the Strait. Notably, the agreement did not require Iran to guarantee free passage outright. It committed Iran only to “best efforts” to allow commercial vessels through, without charge, for a 60-day period, language Iran subsequently interpreted as preserving its right to control and eventually toll traffic through the waterway. That ambiguity proved to be the seed of the breakdown that followed.
Brent crude began 2026 at $61 per barrel. After rising tension pushed prices to $72 by February 27, the conflict triggered the single largest quarterly oil price increase on an inflation-adjusted basis since at least 1988, per the EIA. Prices reached nearly $120 per barrel at their peak — a 65% increase in less than two weeks. March 2026 was one of the largest single-month oil price surges on record, with Brent gaining 51% in the month alone. As of this writing, Brent trades around $111. The Strait remains effectively closed. The IEA has warned the market could remain materially undersupplied through October even if a resolution is reached next month.
Roughly a week after the memorandum was signed, an Iranian drone struck the Ever Lovely, a Singapore-flagged container ship transiting near Oman. The U.S. responded with strikes on Iranian missile and drone storage sites and coastal radar installations, and further retaliatory exchanges followed in Iran, Kuwait, and Bahrain over the following days. Oil, which had drifted back toward the mid-$70s as the memorandum took hold, jumped back above $76/barrel on the news.
The fragile calm gave way entirely on July 8th, when President Trump, speaking at the NATO summit in Ankara, declared the ceasefire “over.” A U.S. strike the following day hit the area around Iran’s Bushehr nuclear power plant. Fighting continued through much of the month; Iranian state media reported roughly 95 U.S. strikes across a dozen cities over a 10-day stretch, and Iran-backed Houthi forces in Yemen separately threatened a blockade of Saudi ports, opening a new front. Regional mediators, including Oman and Qatar, floated a fresh 10-day ceasefire proposal in mid-July, which as of this writing neither side has formally accepted.
Oil markets have moved accordingly. Brent crossed $100/barrel again on July 23rd following strikes on Saudi tankers and energy infrastructure. On July 27th, the U.S. paused further strikes at Iran’s request, and Brent fell more than 13% in two days, its sharpest drop since the original April ceasefire. Two days later, Iran fired ballistic missiles at a U.S. base in Jordan, which U.S. forces intercepted; Brent jumped nearly 8% in response. As of this writing, Brent trades above $88/barrel, up more than 20% for the month of July alone.
The Pattern Repeats Itself
In our last letter, we described three layers of economic damage from the initial conflict: a commodity tax on consumers and businesses, an uncertainty premium that delays capital spending and hiring decisions globally, and a global discrepancy in which the U.S. feels this crisis far less acutely than Japan, South Korea, India, or Europe, all of which depend far more heavily on Hormuz-transited oil. None of that has changed. What has changed is that we are now watching those three layers repeat themselves in real time, roughly on a quarterly cycle: strike, retaliation, diplomatic framework, fragile calm, violation, strike again.
This repetition itself is worth examining as a market risk, separate from any single episode. A shock that happens once is priced as an event. A shock that happens on a recurring cycle creates risk that it may become background noise that markets stop pricing altogether, precisely because each occurrence has, so far, been followed by a de-escalation. We would caution against that conclusion. A pattern that has been resolved twice is not evidence that it always will. Mediators, this time led by Oman rather than Pakistan, are again working toward a framework for managing traffic through the Strait. We hope they succeed. We are not prepared to underwrite that outcome with our own capital.
II. The Hollowing Out, Continued — and the Fed’s Response to It
In our third quarter 2025 letter, we introduced the concept of the hollowing out of the American workforce: a structural, AI-driven reshaping of white-collar employment concentrated in the middle of the income ladder. In our first quarter 2026 letter, we pointed to Cisco as the clearest illustration to date, a company posting record revenue and a stock at all-time highs while simultaneously cutting thousands of jobs. The second quarter gave us a longer list of companies telling the same story.
The List Keeps Growing
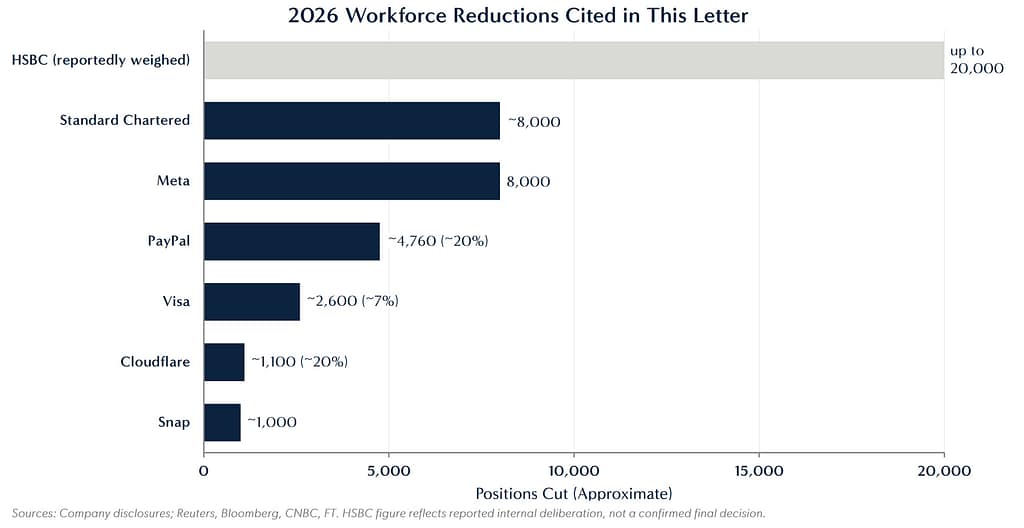
– Meta announced 8,000 layoffs in May, with additional reductions signaled for the second half of the year.
– Cloudflare cut approximately 1,100 positions, roughly 20% of its workforce, in early May, even as it reported its highest quarterly revenue in company history. CEO Matthew Prince noted the cuts fell heavily on middle management, finance, legal, and internal audit functions.
– Snap eliminated roughly 1,000 roles, with CEO Evan Spiegel citing AI’s reduction of repetitive work and an expected $500 million in annualized savings.
– McKinsey, Groupon, Wix, and Workday all announced reductions explicitly tied to AI-driven restructuring.
– PayPal announced in May that it will eliminate approximately 20% of its workforce, roughly 4,760 roles, over the next two to three years under new CEO Enrique Lores, targeting at least $1.5 billion in run-rate savings as part of a broader push to integrate AI across the business.
– Visa announced the morning this letter was written that it is cutting approximately 7% of its workforce, or roughly 2,600 roles, concentrated in technology and product teams. CEO Ryan McInerney framed the move as reinvestment toward the company’s highest-potential opportunities, and Bloomberg reported that AI-driven efficiency, while not the sole factor, played a meaningful role in the decision. Visa’s move follows peer Mastercard’s announced 4% workforce reduction earlier this year and Block’s cut of nearly half its workforce in February.
According to Yahoo, tech companies alone cut roughly 170,000 positions in the first half of 2026. What is more telling than the total is the trend inside it: the share of layoff announcements naming AI as a contributing factor rose from roughly 7% in January to 40% by May. AI is not yet the majority explanation companies give for cutting headcount. It is, by a wide margin, the fastest growing one.
It Is Not Just Tech, and It Is Not Just America
The most instructive evidence this quarter may not come from Silicon Valley at all. It comes from London, one of the world’s largest banking and professional services hubs, where the entry-level, white-collar career path is quietly disappearing. A search for open financial analyst roles on Adzuna, a leading UK recruitment site, returns roughly 80 listings today. Four years ago, the same search returned more than 350. White-collar postings overall now make up only about a quarter of total London job vacancies, down from nearly half in 2022, according to data from Adzuna.
The financial services industry is candid about why. McKinsey reports that banks are cutting junior analyst classes by as much as two-thirds, even as roughly 62% of the AI talent those same banks are hiring is sourced from those identical entry-level cohorts. Standard Chartered has moved to cut approximately 8,000 roles it attributes to AI-driven efficiency. HSBC has reportedly weighed eliminating as many as 20,000 positions on the expectation that AI will reduce staffing needs across its middle and back offices. One hedge fund recruiter described the shift bluntly: funds that once staffed three junior analysts to sift through company filings now assign that work to a single person overseeing an AI model.
This is a useful corrective to any assumption that the hollowing out is a uniquely American, or uniquely technology-sector, phenomenon. Research commissioned by the Greater London Authority found that roughly half of that city’s workforce, an estimated 2.4 million people, hold jobs in which AI can automate a meaningful share of daily tasks. More than 300,000 London workers, including bookkeepers, brokers, and administrative staff, sit in the highest-risk category. Another 748,000, spanning economists, software developers, and accountants, sit in the next tier down.
Bank leadership on both sides of the Atlantic have been candid about the direction of travel. JPMorgan CEO Jamie Dimon stated plainly in December that the technology “will eliminate jobs.” Whatever the specific framing, the message reinforces the same structural point we made about Cisco last quarter: these cuts are coming from healthy, profitable institutions making deliberate choices about where human labor is still required, not from firms in distress.
A Second, Compounding Development: The Federal Reserve Has Little Flexibility
Here is where the second quarter introduced something genuinely new, and it is a development we believe deserves far more attention than it has received. Through most of the past two years, the market’s working assumption was straightforward: if AI-driven layoffs began to soften the labor market meaningfully, the Federal Reserve would respond by cutting interest rates to support growth. That assumption provided a kind of cushion, a belief that even if hollowing out continued, monetary policy would eventually lean in to offset it.
That cushion is no longer there. Under new Chair Kevin Warsh, the Fed held its benchmark rate at 3.50 to 3.75% at its July 29th meeting, its fifth consecutive hold, but this was no routine decision. Three of the 12 voting members, Cleveland’s Beth Hammack, Minneapolis’s Neel Kashkari, and Dallas’s Lorie Logan, dissented in favor of an immediate quarter-point increase, one of the most contentious Federal Open Market Committee votes in years. Inflation itself has moved to roughly 4.2%, well above the Fed’s 2% target, driven in no small part by the oil shock described in Section I. Chair Warsh reaffirmed the Fed’s commitment to bringing inflation under control but offered no clear forward guidance, leaving markets to conclude the committee is postponing a hike it increasingly views as inevitable. As of this writing, markets are pricing roughly a 63% probability of a rate increase at the September meeting.
The bond market did not wait for September to render its verdict. In the two trading sessions following the Fed’s announcement, the 10-year U.S. Treasury yield rose to 4.75%, its highest level since January 2025, and the 30-year Treasury yield surged to 5.27%, its highest level since 2007, a 19-year high. This is a substantial, and significantly underappreciated, development. It means the cost of long-term capital in the U.S., the rate that underpins mortgages, corporate borrowing, and the discount rate applied to every long-duration asset including equities, has moved sharply higher in a matter of days, even though the Fed itself has not raised its own benchmark rate at all this year. In an important sense, the bond market is doing the Fed’s tightening for it.
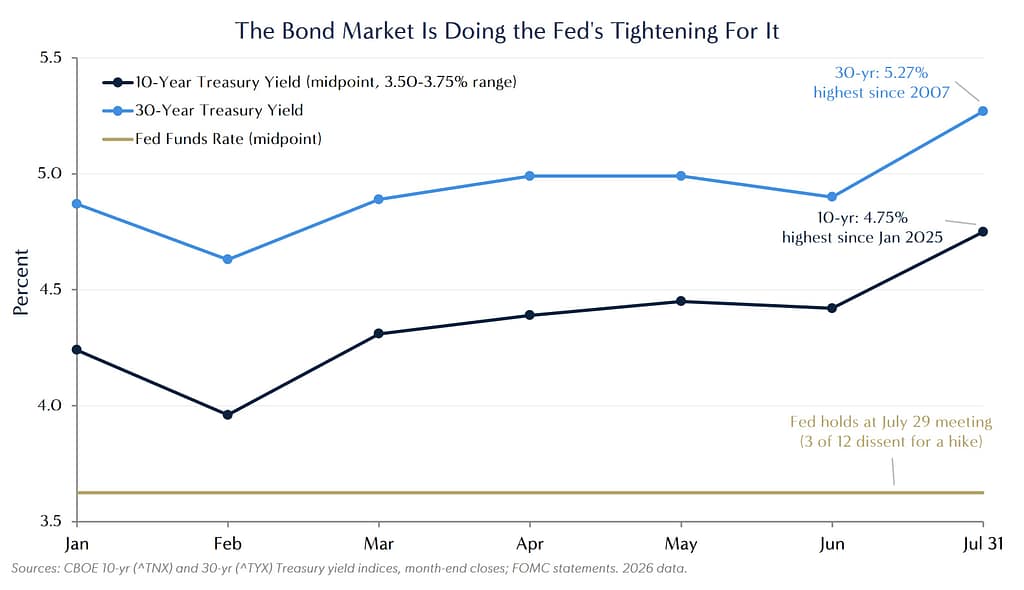
Put these pieces together and the picture becomes clearer than any one piece is on its own. Companies are reducing headcount for structural, AI-driven reasons that have nothing to do with distress. Ordinarily, a softening labor market gives a central bank room to cut rates. This time, an oil-driven inflation shock has taken that room away, and the bond market has responded by pushing long-term borrowing costs to multi-decade highs on its own. The Federal Reserve is, in its own words and ours, in a box. It cannot easily cut to support a labor market being reshaped by technology without risking an inflation problem it is already fighting, and now it is doing so while the market it is supposed to influence has effectively started tightening without it. That is a materially less comfortable combination than the one investors were pricing as recently as our last letter.
III. A Market Still Not Asking the Hard Questions
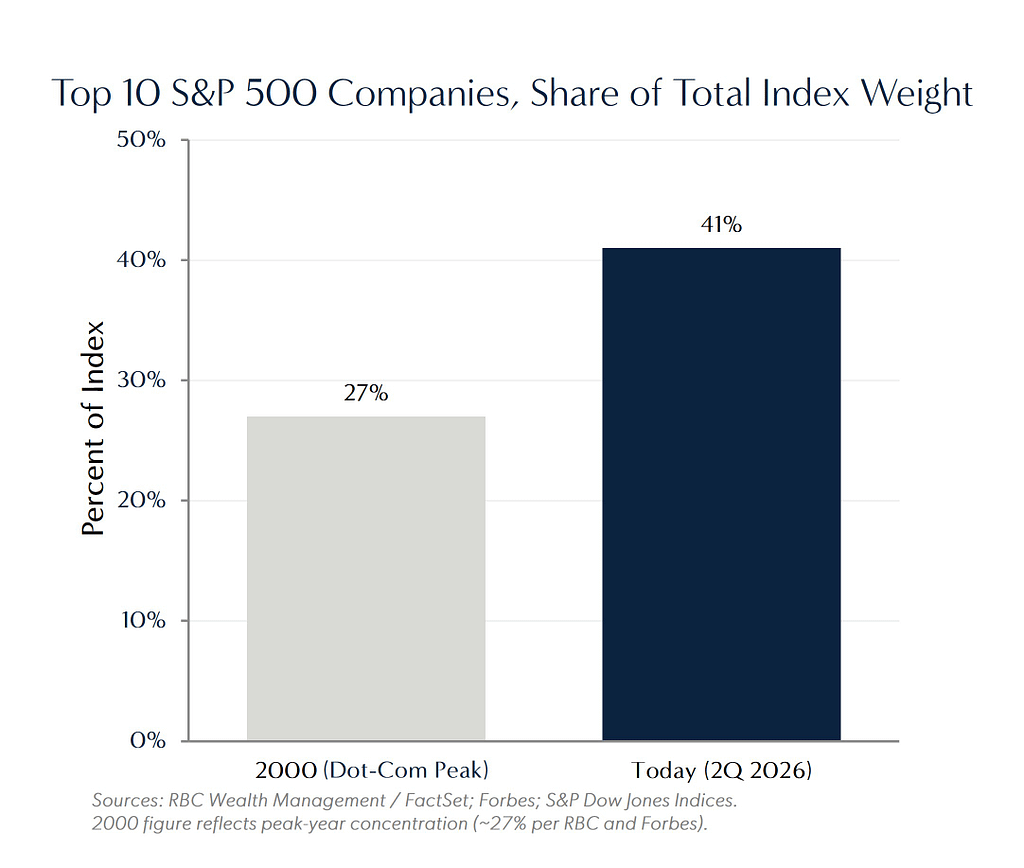
The chart above tells a story that a single data point cannot. Today’s top 10 companies represent 41.7% of the entire S&P 500 — a level of concentration that has no modern precedent. At the dot-com peak in 2000, widely regarded as the most concentrated and speculative market of the modern era, the top 10 represented 25.3% of the index. We are now more than 16 percentage points above that prior extreme.
Concentration Updated
Index concentration has remained near the records we described last quarter. The top 10 companies in the S&P 500 represent roughly 41% of the entire index, essentially unchanged from the first quarter and still well above the 26.6% level reached at the peak of the dot-com bubble in 2000. Those same top 10 names trade at approximately 26 times earnings, a 25% premium to their own long-term average, while contributing just over a third of the index’s total earnings. The gap between what these companies are worth and what they actually earn continues to widen. Separately, the broader concentration picture has grown even more pronounced further down the list: the top 25 stocks in the S&P 500 now represent more than 50% of the index.
The Yield Comparison Has Not Improved
The dividend yield on the S&P 500 remains near the lowest levels in recorded history. Until this week, the comparison to Treasuries was already unflattering. It has now become considerably more so. As described in Section II, the 10-year Treasury yield has climbed to 4.69% and the 30-year has surged to 5.23%, a level not seen since 2007. An investor collecting a virtually risk-free 5.2% from a 30-year government bond is being offered a dramatically lower yield from equities, where they are also taking on significant concentration risk and the volatility that comes with a market this narrowly led. We described this yield gap as unattractive last quarter, when the 30-year was meaningfully lower than it is today. It has since gotten worse, not better.
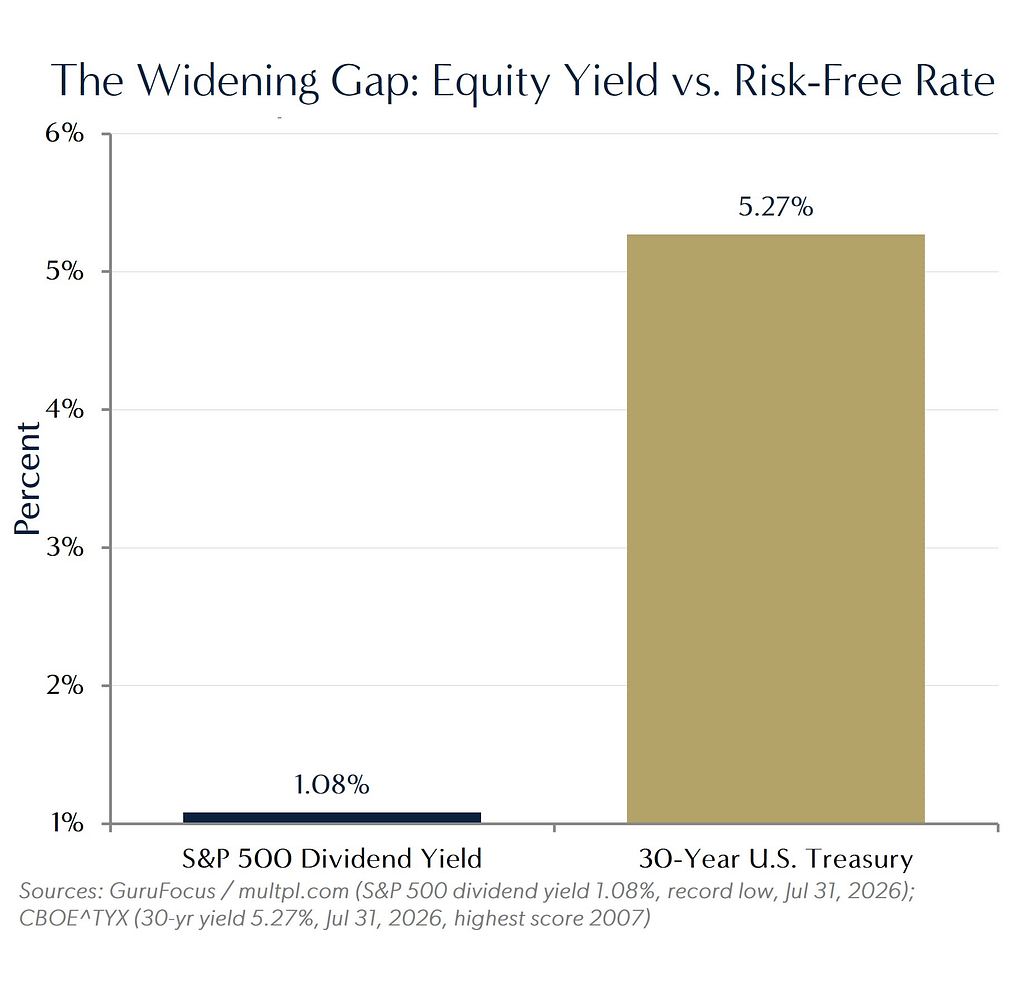
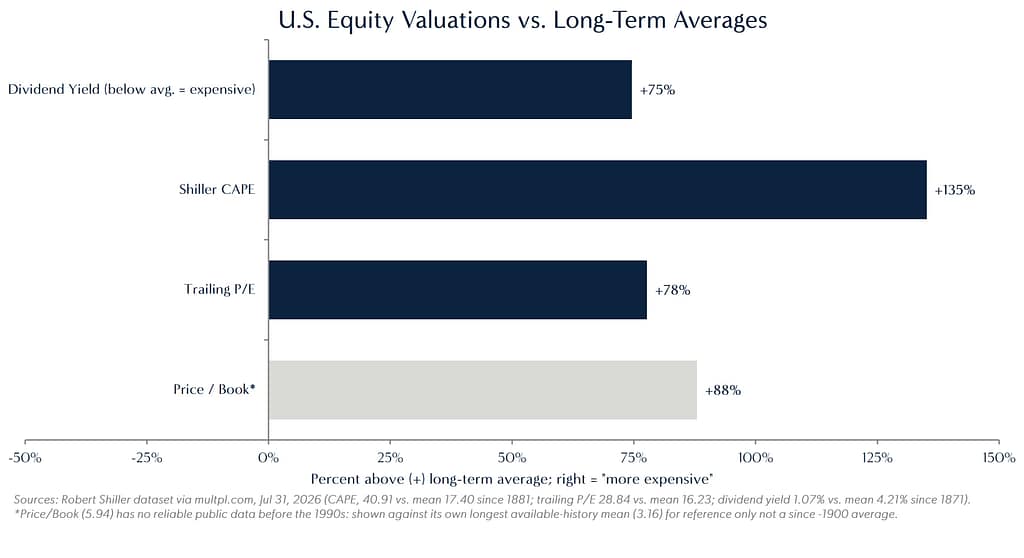
This matters for valuations in a very direct, mechanical way, not just as a comparison point. Equity valuations are, at their core, a function of the discount rate applied to future cash flows. When the risk-free rate that anchors the discount rate rises as sharply as it has over the past week, the present value of those same future cash flows should, all else equal, fall. That the S&P 500 has not meaningfully repriced lower in response to a 19-year high in the 30-year Treasury is, in our view, another sign of a market choosing not to ask the hard questions. Higher long-term rates raise the cost of capital for every business, compress the multiple investors should be willing to pay for the same forward earnings, and make the dividend and earnings yields on offer from equities look worse by the day. None of this requires a recession or a policy mistake to matter. It is simple arithmetic, and for now, the market is choosing to ignore it.
A Brief Word on Private Credit
We continue to hold the position we outlined last quarter. Most high-profile private credit defaults are not a story about AI disruption; they are a story about fraud, over-leveraged borrowers, and underwriting that did not hold up once rates rose. We exited nearly all our private credit exposure at the end of 2024 because we did not see a favorable risk-reward, and we continue to consider episodic opportunities today only where genuine mispricing exists. Not all private credit is equal, and the headline narrative continues to paint with too broad a brush.
IV. We Are Building
Amid all of this, our Team’s work has not slowed down. We continue to invest in the people, systems, and capabilities that will serve our Partners over the next 25 years, not just the next quarter. We look forward to sharing more detail on those initiatives as they come to fruition later this year.
We continue to operate with the mindset that we are a 25-year-old startup. Please help us accomplish our objectives by referring world-class talent to us. We are adding to our Team in every department, and you likely know or work with people in the industry who are outstanding at what they do and would be a cultural fit for us. Please forward this letter to them, and copy us on the email, as a way to introduce them to what we are doing.
The world remains complicated. Markets, for now, are choosing to look past that complexity. We do not believe complexity of this magnitude, layered many different ways, resolves itself quietly. That does not mean the next move in markets is down, or that it happens on any particular timeline. It means this is not a moment for complacency.
We are grateful for the trust you place in us. Our best work remains ahead of us.
All our very best,
The CAZ Investments Team